Concept: The Action Potential
Cardiac cells are encased by a cell membrane. Differences in the concentration of
charged particles (called ions) inside and outside the
cell result in a membrane potential - a difference in electric potential
across the membrane. The Action Potential refers to the change in this membrane potential
during excitation, illustrated below.
 Animation: The Action Potential. Left panel shows a schematic of a cell with different types
of ion and the channels which allow them to pass (coloured circles and channels), and the
right panel shows the membrane potential at different stages of the Action Potential.
Animation: The Action Potential. Left panel shows a schematic of a cell with different types
of ion and the channels which allow them to pass (coloured circles and channels), and the
right panel shows the membrane potential at different stages of the Action Potential.
As ions flow through these ion channels, the movement of charge creates ionic currents which can change the membrane potential. Because the opening and closing of ion channels can also be controlled by the membrane potential, the currents can be coordinated to create the shape of the Action Potential.
There are multiple types of ion channel, each associated with specific ions (sodium, potassium, calcium and others).
"Inward" currents are those where positive charge enters the cell (yellow and red in the animation) - they make the membrane potential more positive, which we call “depolarisation”: Larger inward currents generally mean greater excitability and longer durations of the Action Potential.
"Outward" currents are those where positive charge leaves the cell (blue in the animation) – they make the membrane potential more negative, which we call "repolarisation": Larger outward currents generally mean lower excitability and shorter duration.
The balance of multiple different currents, controlled by the expression (amount of) each type of ion channel, can therefore control Action Potentials with different shapes and properties to match the varying requirements of cardiac function in different animals and under different conditions (e.g. rest versus exercise).
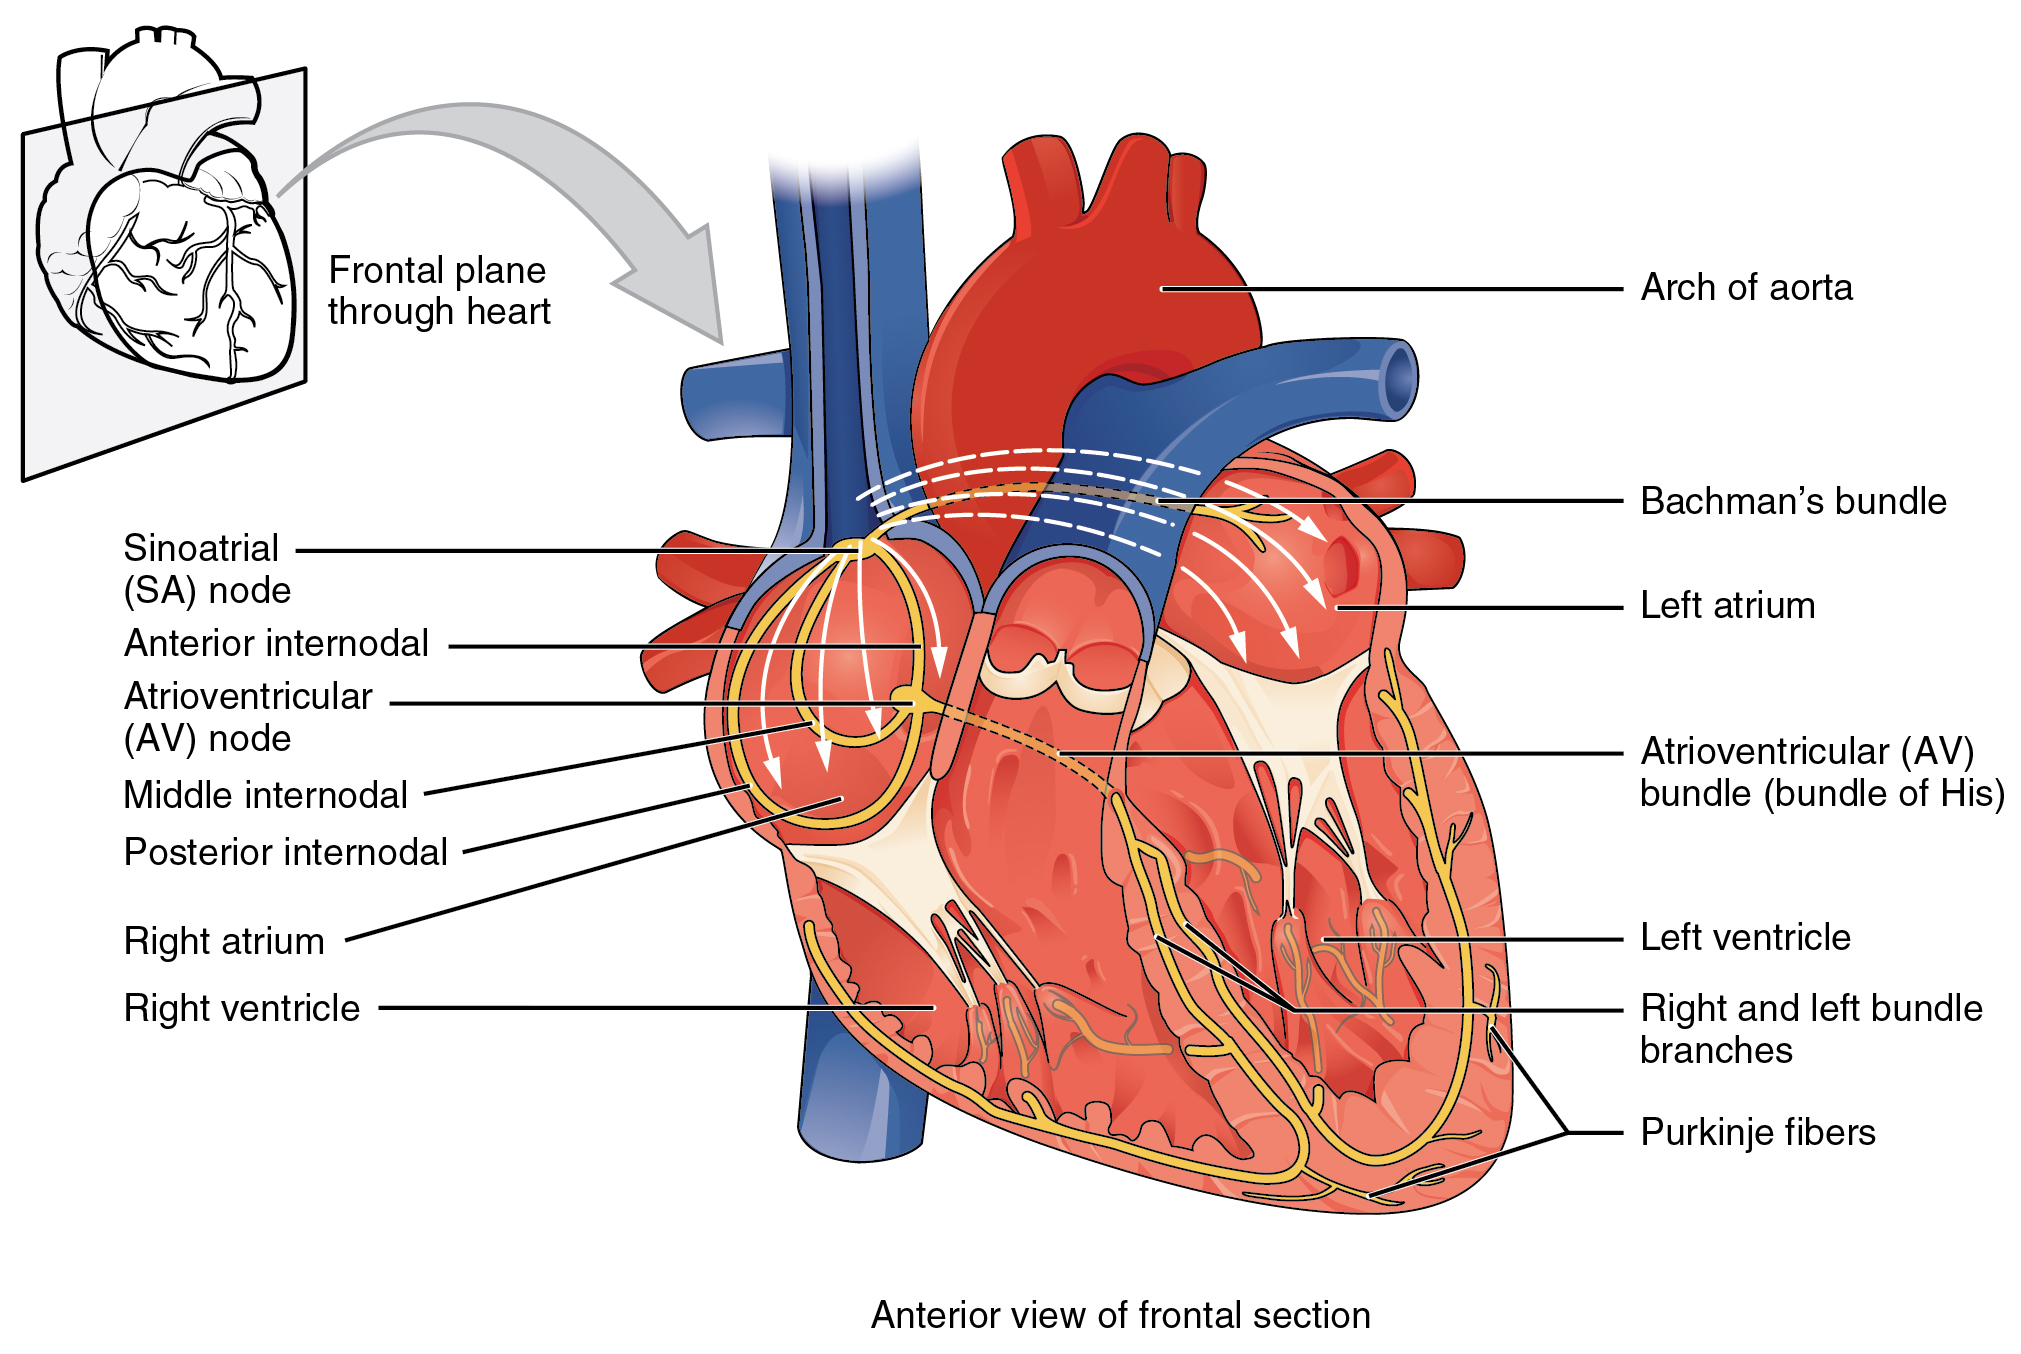 Illustration of the cardiac conduction system. Source:
  Animation: Illustration of re-entrant excitation. The animation shows a 2D idealised sheet of cardiac tissue,
representing, for example, the surface of the heart. The colours (purple-red-yellow) indicate the local
voltage (a surrogate for contraction, as the voltage is the contractile trigger). On the left is a representation
of normal behaviour: excitation originates from a single source and propagates through the tissue uniformly;
there are significant rest periods between each excitation.
On the right is an example of a simple
form of re-entry - a "stable scroll wave". This type of excitation is rapid (note the minimal resting/relaxation
period between each cell's excitation time) and, because it self-perpetuates, it is independent of the
primary pacemaker.
Animation: Illustration of re-entrant excitation. The animation shows a 2D idealised sheet of cardiac tissue,
representing, for example, the surface of the heart. The colours (purple-red-yellow) indicate the local
voltage (a surrogate for contraction, as the voltage is the contractile trigger). On the left is a representation
of normal behaviour: excitation originates from a single source and propagates through the tissue uniformly;
there are significant rest periods between each excitation.
On the right is an example of a simple
form of re-entry - a "stable scroll wave". This type of excitation is rapid (note the minimal resting/relaxation
period between each cell's excitation time) and, because it self-perpetuates, it is independent of the
primary pacemaker.
 Animation: Illustration of the concept of the refractory period in single cells.
This shows three cases where the first beat is identical, but the timing of the next stimulus
varies (late - purple; just outside refractory period - blue; just inside refractory period - orange).
The dotted line shows where the amplitude threshold is.
Animation: Illustration of the concept of the refractory period in single cells.
This shows three cases where the first beat is identical, but the timing of the next stimulus
varies (late - purple; just outside refractory period - blue; just inside refractory period - orange).
The dotted line shows where the amplitude threshold is.
 Animation: Illustration of the concept of the refractory period in tissue.
On the left is shown the local voltage in a strand of cardiac cells (colours purple-red-yellow indicate
local voltage). The stimulus is applied to the top edge,
and propagates along the strand to the bottom edge. On the right are traces of the voltage from cells taken
from different parts of the strand (indicated by the markers on the strand) - by the stimulus site (blue)
and towards the far end (red).
Animation: Illustration of the concept of the refractory period in tissue.
On the left is shown the local voltage in a strand of cardiac cells (colours purple-red-yellow indicate
local voltage). The stimulus is applied to the top edge,
and propagates along the strand to the bottom edge. On the right are traces of the voltage from cells taken
from different parts of the strand (indicated by the markers on the strand) - by the stimulus site (blue)
and towards the far end (red). Animation: Illustration of unidirectional conduction block due to heterogeneity. Two stimuli are applied to
a homogeneous and heterogeneous sheet; the first is from the upper edge. It propagates uniformly
through the tissue in both cases. The second is applied to a small region in the centre, at the junction
between the region with a short AP (top half) and the one with a long AP (bottom half) in the heterogeneous case. Note
that you can see this difference in the heterogeneous case following the first stimulus,
by the bottom half staying active for longer than the top.
Animation: Illustration of unidirectional conduction block due to heterogeneity. Two stimuli are applied to
a homogeneous and heterogeneous sheet; the first is from the upper edge. It propagates uniformly
through the tissue in both cases. The second is applied to a small region in the centre, at the junction
between the region with a short AP (top half) and the one with a long AP (bottom half) in the heterogeneous case. Note
that you can see this difference in the heterogeneous case following the first stimulus,
by the bottom half staying active for longer than the top.
 Animation: Simulation of applying rapid stimuli to the junction between two atrial regions: the "Crista Terminalis", yellow,
and the normal atrial tissue, blue, both shown in the left panel. The Crista Terminalis has a significantly longer
AP (and refractory period) than the surrounding tissue. Applying multiple rapid stimuli to a small region on the junction of these
tissue types resulted in significant conduction block and the eventual emergence of a full re-entrant circuit (right panel).
Animation made from data associated with
Animation: Simulation of applying rapid stimuli to the junction between two atrial regions: the "Crista Terminalis", yellow,
and the normal atrial tissue, blue, both shown in the left panel. The Crista Terminalis has a significantly longer
AP (and refractory period) than the surrounding tissue. Applying multiple rapid stimuli to a small region on the junction of these
tissue types resulted in significant conduction block and the eventual emergence of a full re-entrant circuit (right panel).
Animation made from data associated with 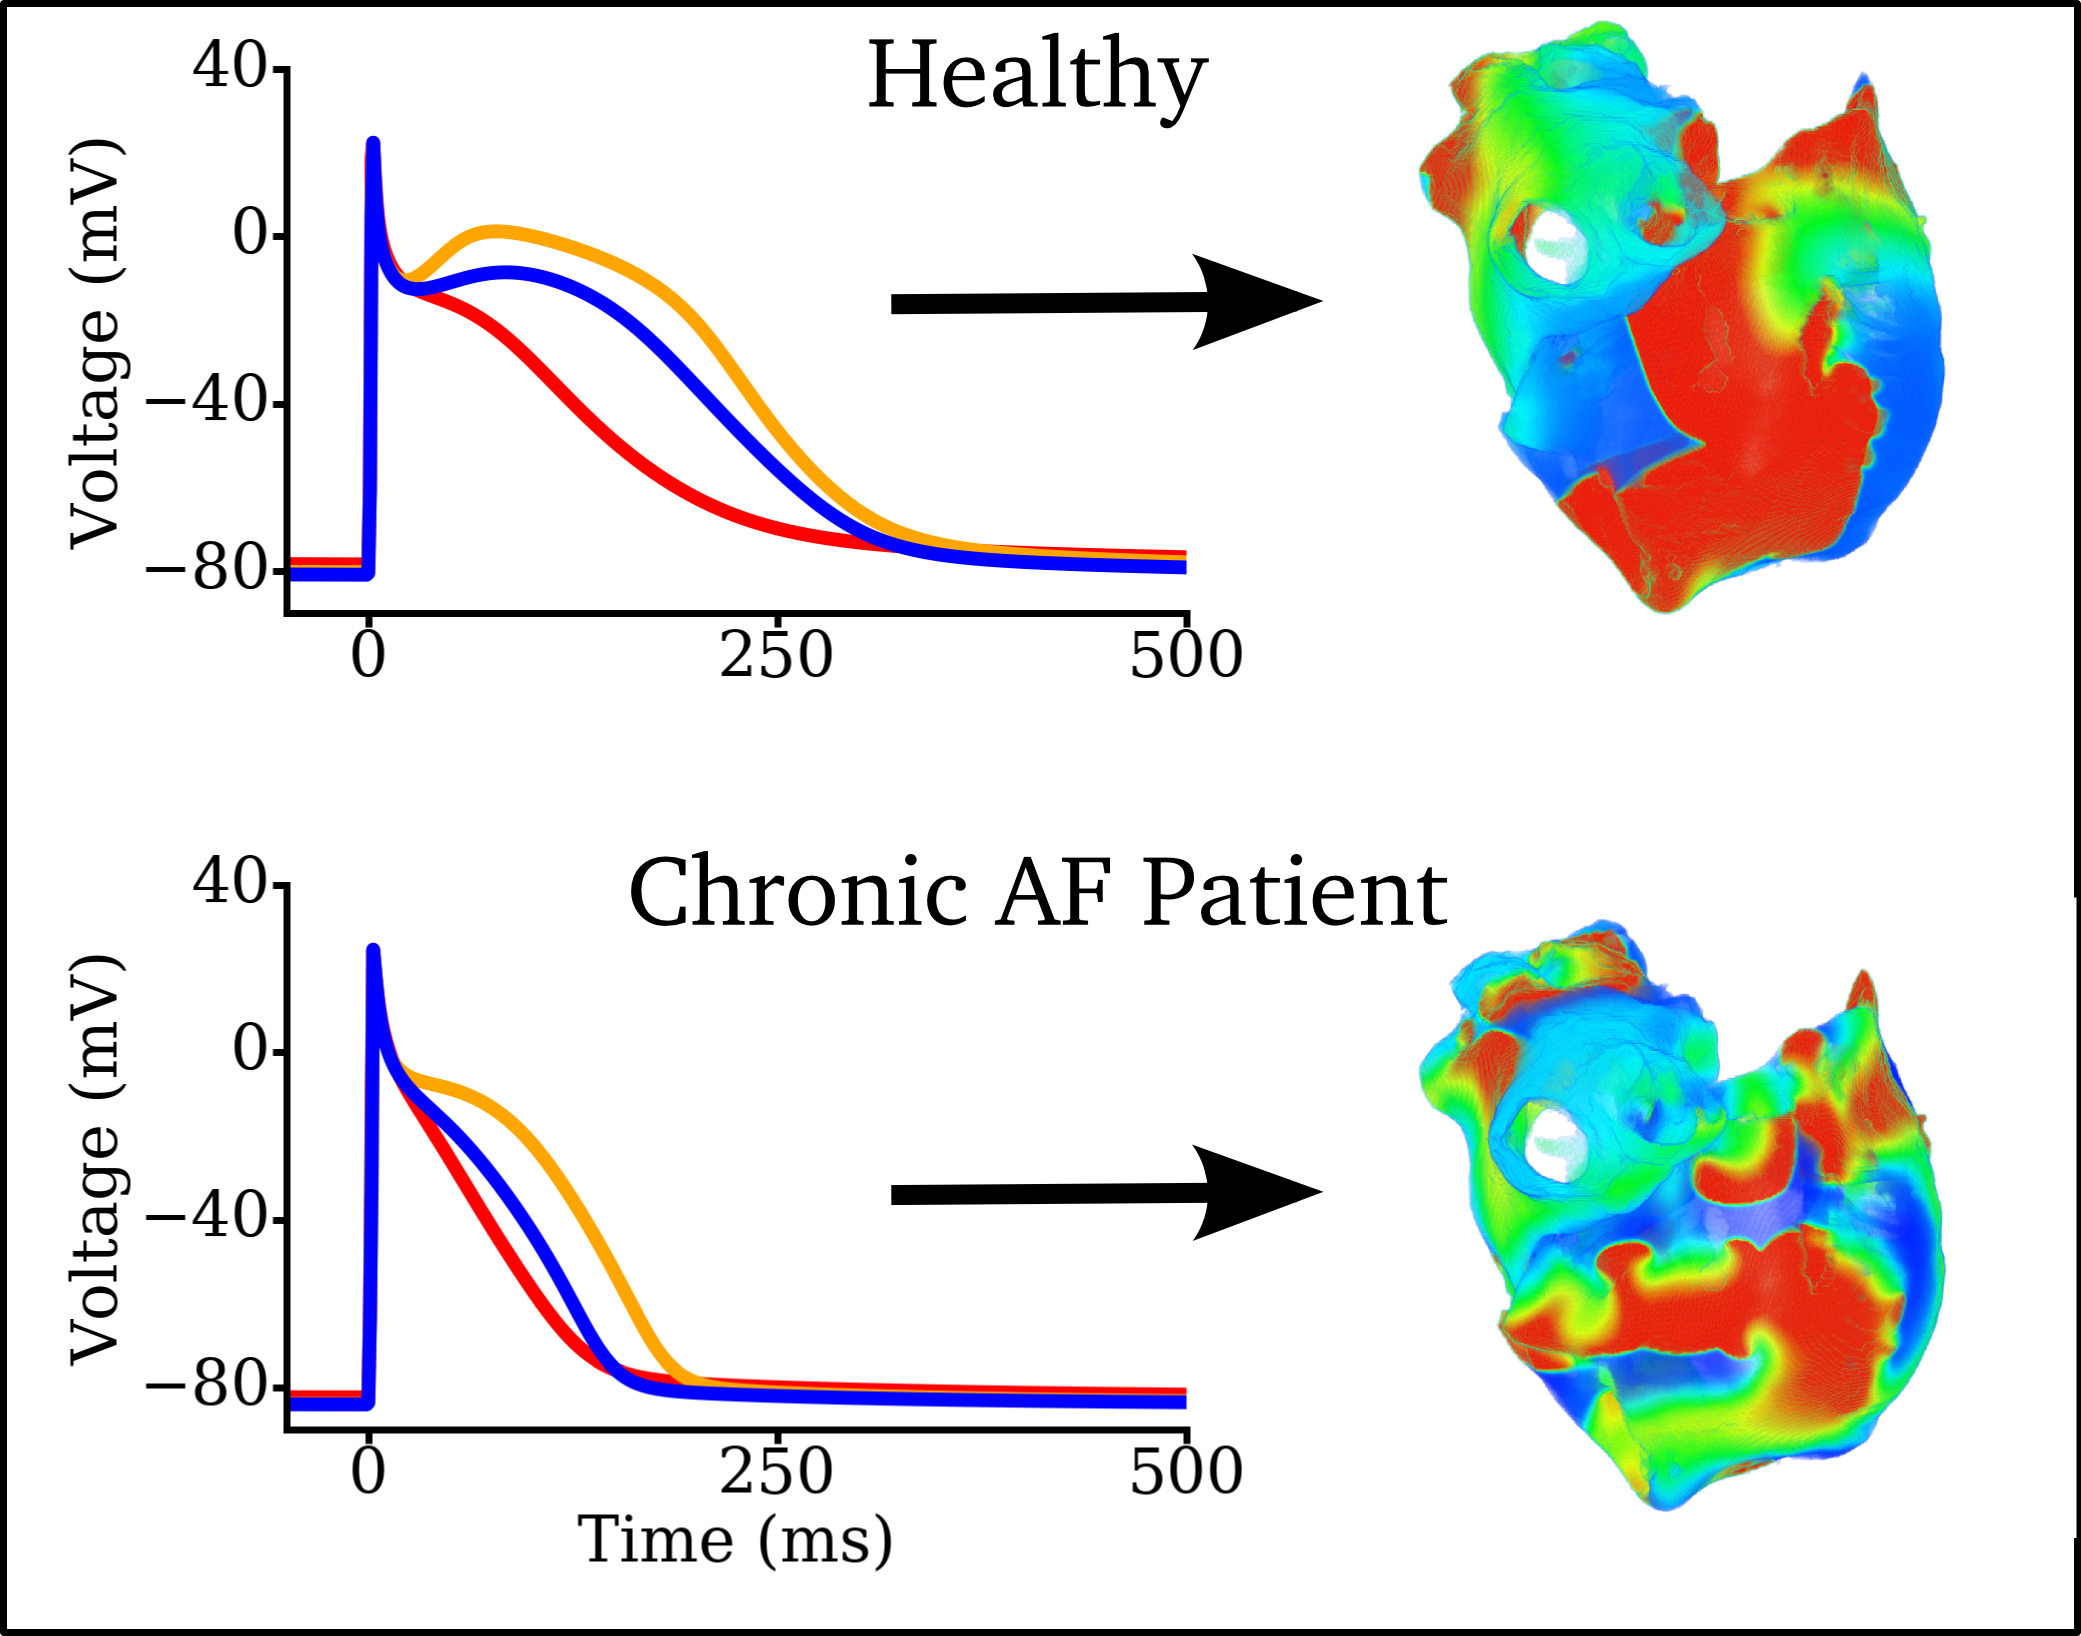 Figure: Left panels: Illustration of Action Potentials from three different atrial regions in a healthy person (top)
and in a general, long-term chronic AF patient (bottom). Right panels: Example snapshots of simulated re-entry during
AF with the healthy or chronic AF underlying electrophysiolgy.
Data from
Figure: Left panels: Illustration of Action Potentials from three different atrial regions in a healthy person (top)
and in a general, long-term chronic AF patient (bottom). Right panels: Example snapshots of simulated re-entry during
AF with the healthy or chronic AF underlying electrophysiolgy.
Data from 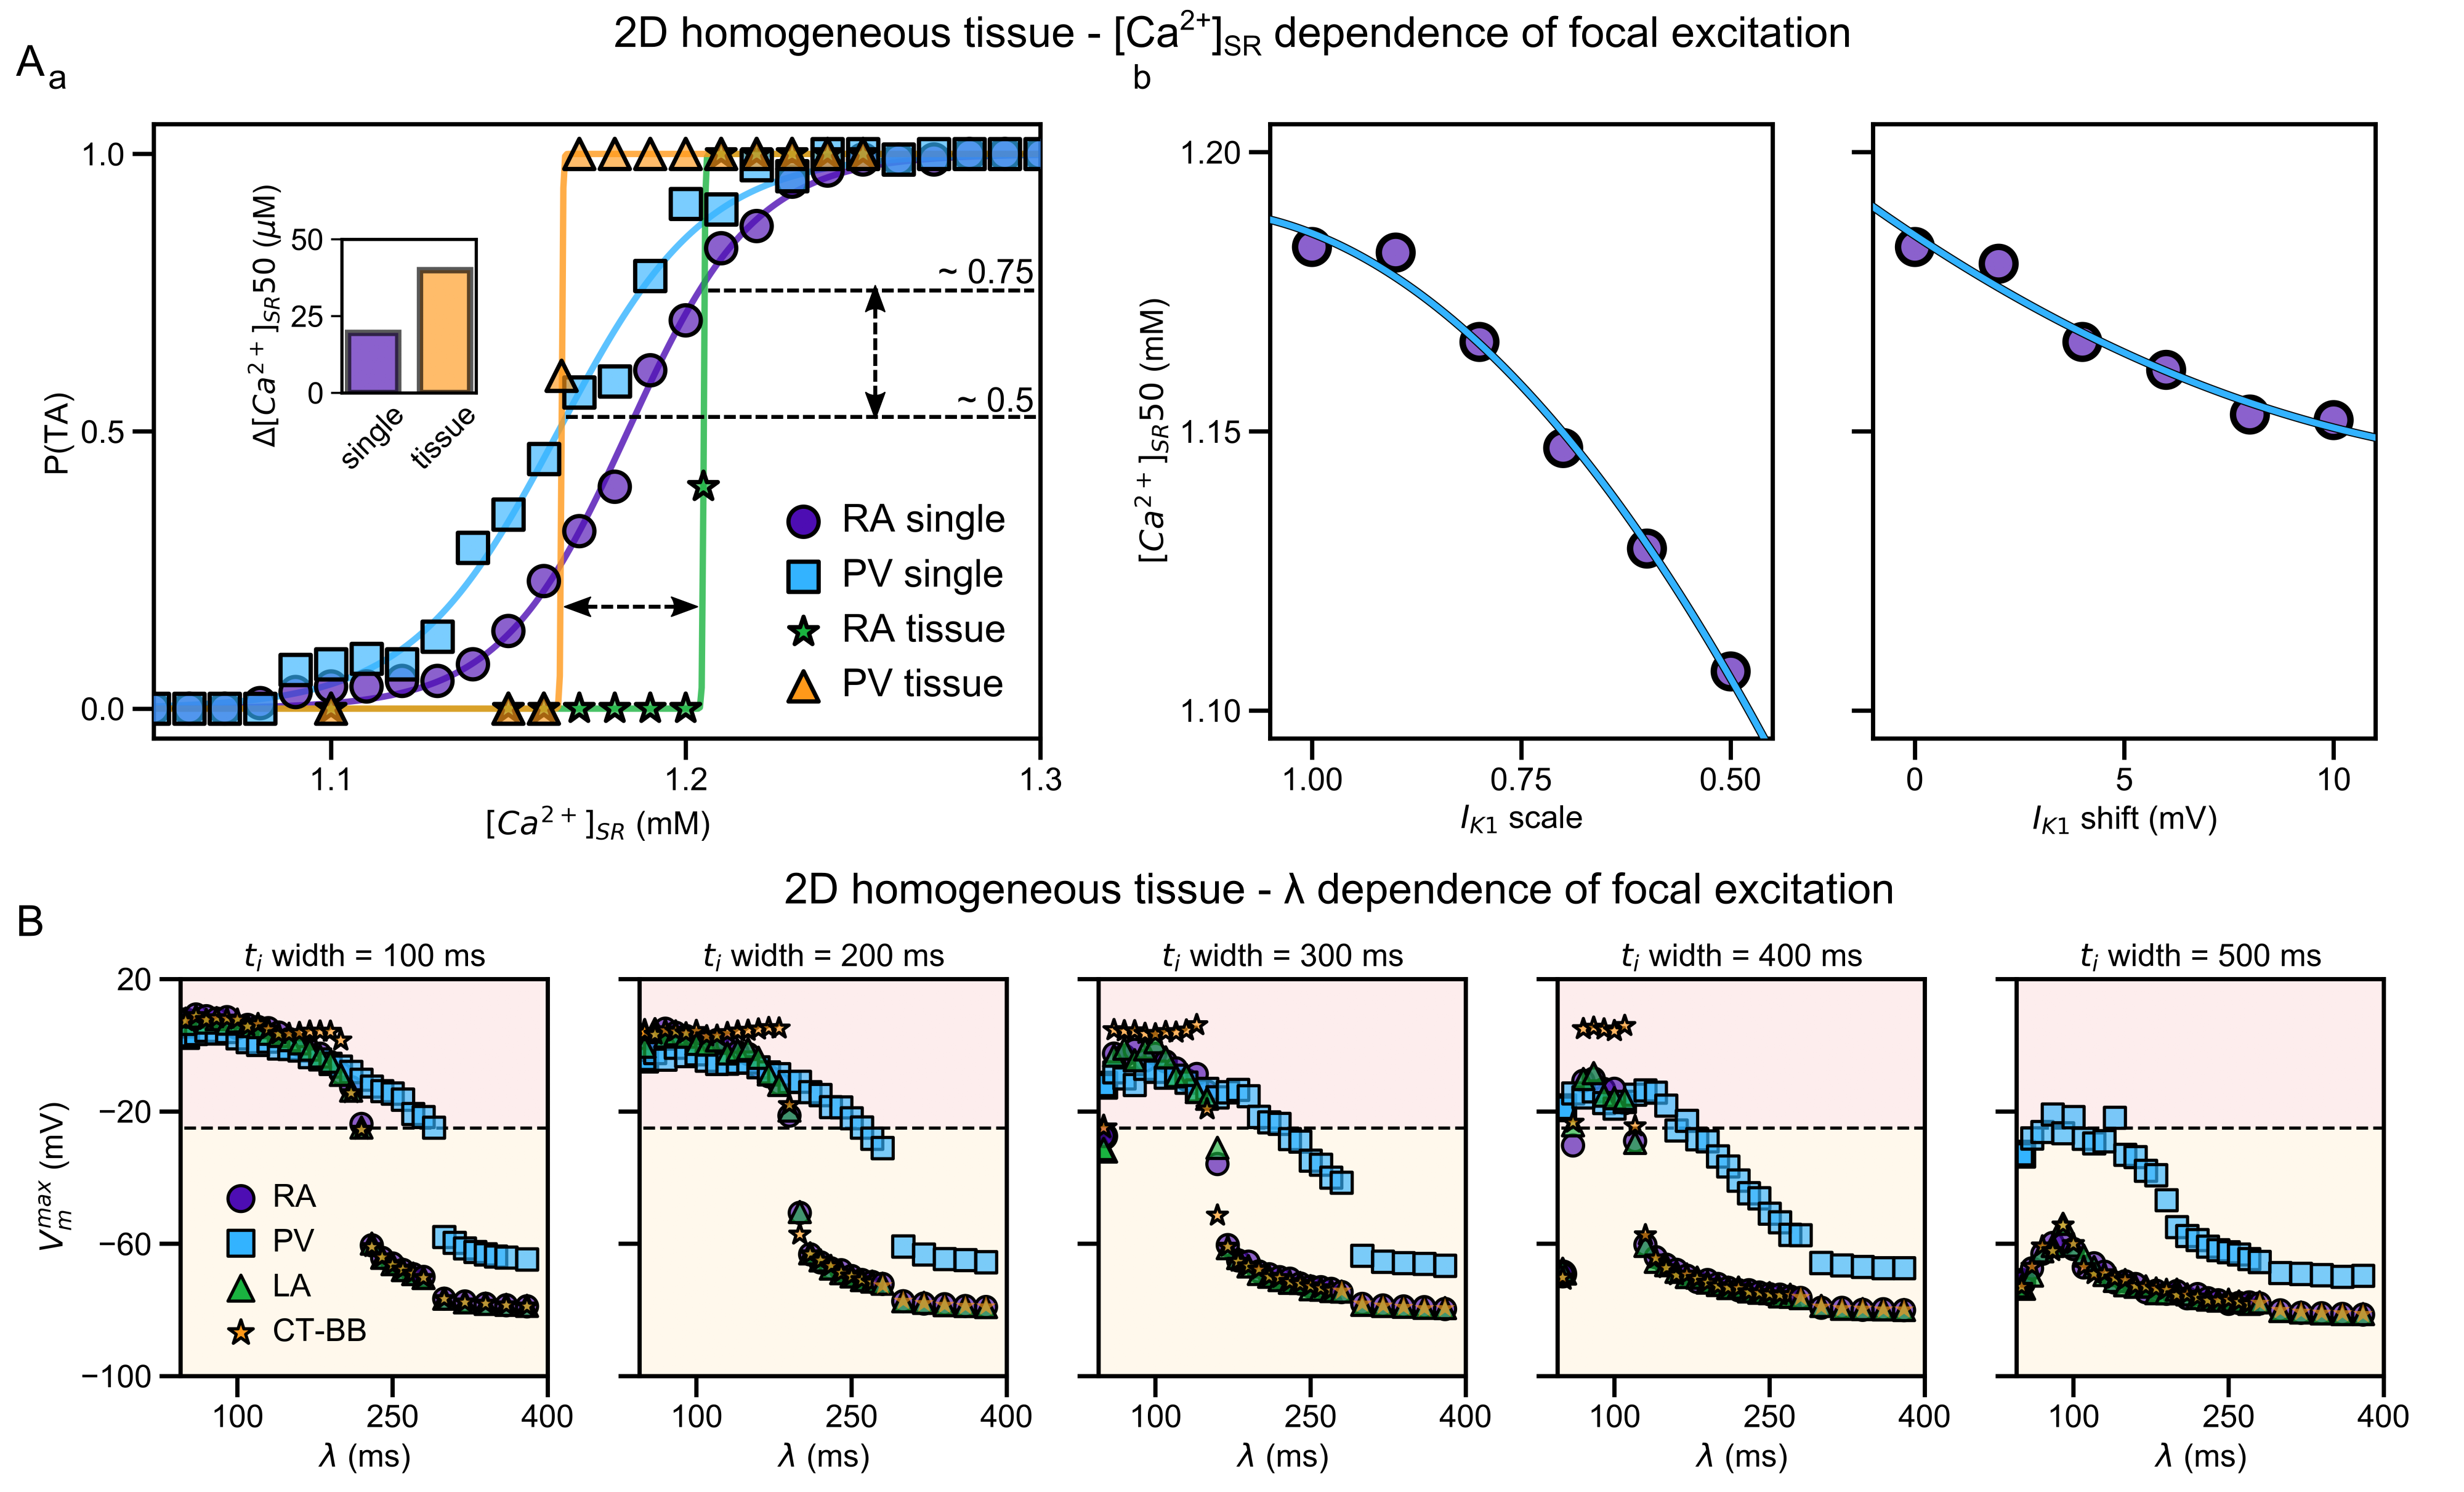 Illustration of the higher susceptibility of the pulmonary vein (PV) region to abnormal spontaneous excitation.
From
Illustration of the higher susceptibility of the pulmonary vein (PV) region to abnormal spontaneous excitation.
From  Animation: Spontaneous initation of re-entrant-like activity originating at the border of a fibrosis and non-fibrosis region.
From:
Animation: Spontaneous initation of re-entrant-like activity originating at the border of a fibrosis and non-fibrosis region.
From: 