Non-invasive mapping

Understanding what is going on in the heart of a patient is a major and important challenge. Invasive methods can provide detailed mapping of the electrical excitation patterns on the heart, but have significant drawbacks associated with the invasive nature of surgeries.

Methods to attain as much information as possible non-invasively are an attractive prospect to improve patient care. The standard approach is to use an electro-cardiogram (ECG), consisting of a number of electrodes placed around the body, in order to record the changes in the electrical potential on the skin which results from the underlying electrical excitation on the heart. ECGs typically consist of 3 or 12 leads. However, much more extensive mapping arrays have recently been developed, consisting of hundreds of leads covering most of the torso. While more expensive and less easily available than standard clinical ECGs, such systems have the potential to provide significantly more valuable information.

Fundamentals of the ECG

The ECG measures the change in the potential on the skin ("body-surface potential") which results from the changing electrical state of the heart; the changing electric potentials on the surface of the heart have an associated electric field which, while small, can be measured on the skin using contact electrodes. The recordings attained from these signals have a typical shape and are significantly smoothed compared to the actual potentials on the heart. Each part of the ECG waveform is associated with a phase of cardiac excitation.


Concept: The Cardiac Conduction System

This refers to the specialised system within the heart which ensures it contracts in a coordinated manner to give the most efficient pumping function. By initiating the heartbeat in a specialised pacemaker region which spontaneously generates Action Potentials, and then conducting the excitation along specialised networks which can either delay or accelerate the propagation, a uniform and controlled contraction can be maintained.

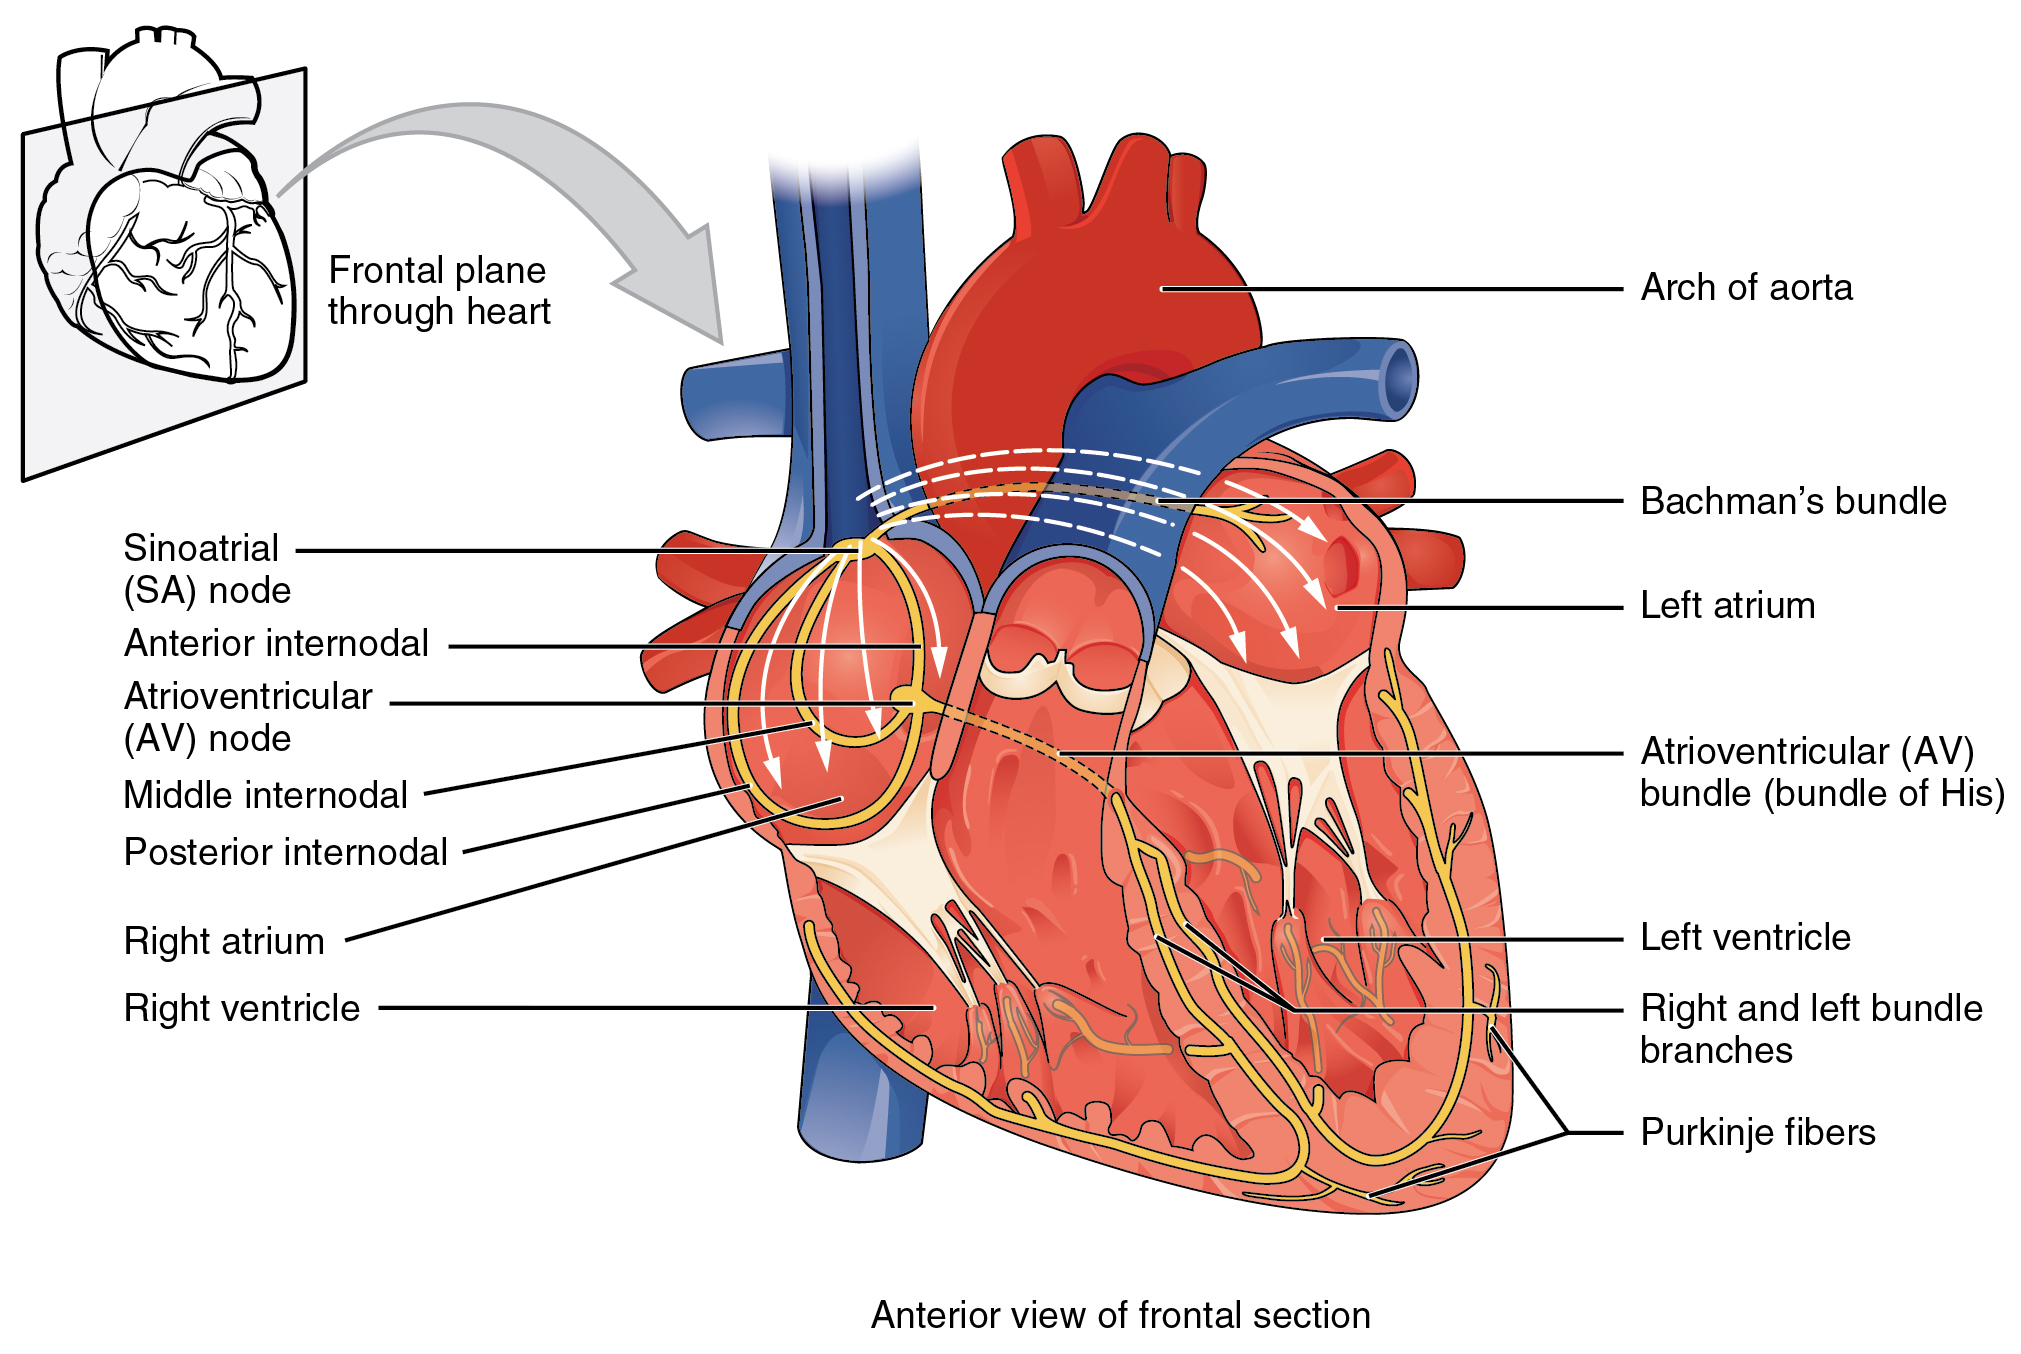
Illustration of the cardiac conduction system. Source: here (public domain) Attribution: OpenStax College [CC BY 3.0 (https://creativecommons.org/licenses/by/3.0)]

On each heartbeat, the following process occurs:
  1. The electrical excitation is initiated in the "sino-atrial node", the natural pacemaker, located near the top of the right atrium.
  2. The excitation is conducted along preferential pathways in the atria (the upper chambers of the heart) and down to the "atrio-ventricular node", the only electrical connection between the atria and ventricles .
  3. As excitation spreads throughout the atria, they contract and the ventricles fill with blood.
  4. Conduction is delayed in the atrio-ventricular node to allow time for the ventricles to fill.
  5. After this delay, excitation is conducted rapidly to the apex (the bottom) of the ventricles, through the bundle of His, before quickly spreading through the Purkinje Fibres throughout the ventricle. This supports near-simultaneous activation of the entire ventricular mass.
  6. The heart then undergoes repolarisation (returning to the non-excited state), allowing the atria and ventricles to fill in preparation for the next beat.


Concept: The ECG

ECGs of healthy patients have a typical form, which may be familiar from representations of the ECG in popular media. The waveform consists of multiple different complexes, which correspond with the different phases of the cardiac conduction cycle.

Image adapted from here (public domain)

  • The first, small deflection corresponds to electrical activation of the atria (phases 1-3 in the description of the cardiac conduction system) and is called the "P-wave".
  • The delay in the atrio-ventricular node, while the ventricles fill (phase 4), results in a flat portion of the ECG, referred to as the "PR-segment".
  • The primary deflection in the ECG corresponds to the rapid ventricular activation (phase 5) and consists of three waves - the Q, R and S - referred to as the "QRS complex".
  • The time between ventricular activation and repolarisation then leads to another flat phase called the "ST-segment".
  • Finally, repolarisation of the ventricles (phase 6) leads to a final major deflection: the "T-wave".

The morphology (shape) and orientation of the different waves, and the relative lengths of the different segments, can provide important information about the state of a patient's cardiac conduction system. The morphology of the P-wave can provide information on the site initiating excitation in the atria; prolonged PR intervals can indicate heart block; inverted or variable T-waves can indicate abnormal repolarisation patterns.


Researching the correlation between the ECG and the heart

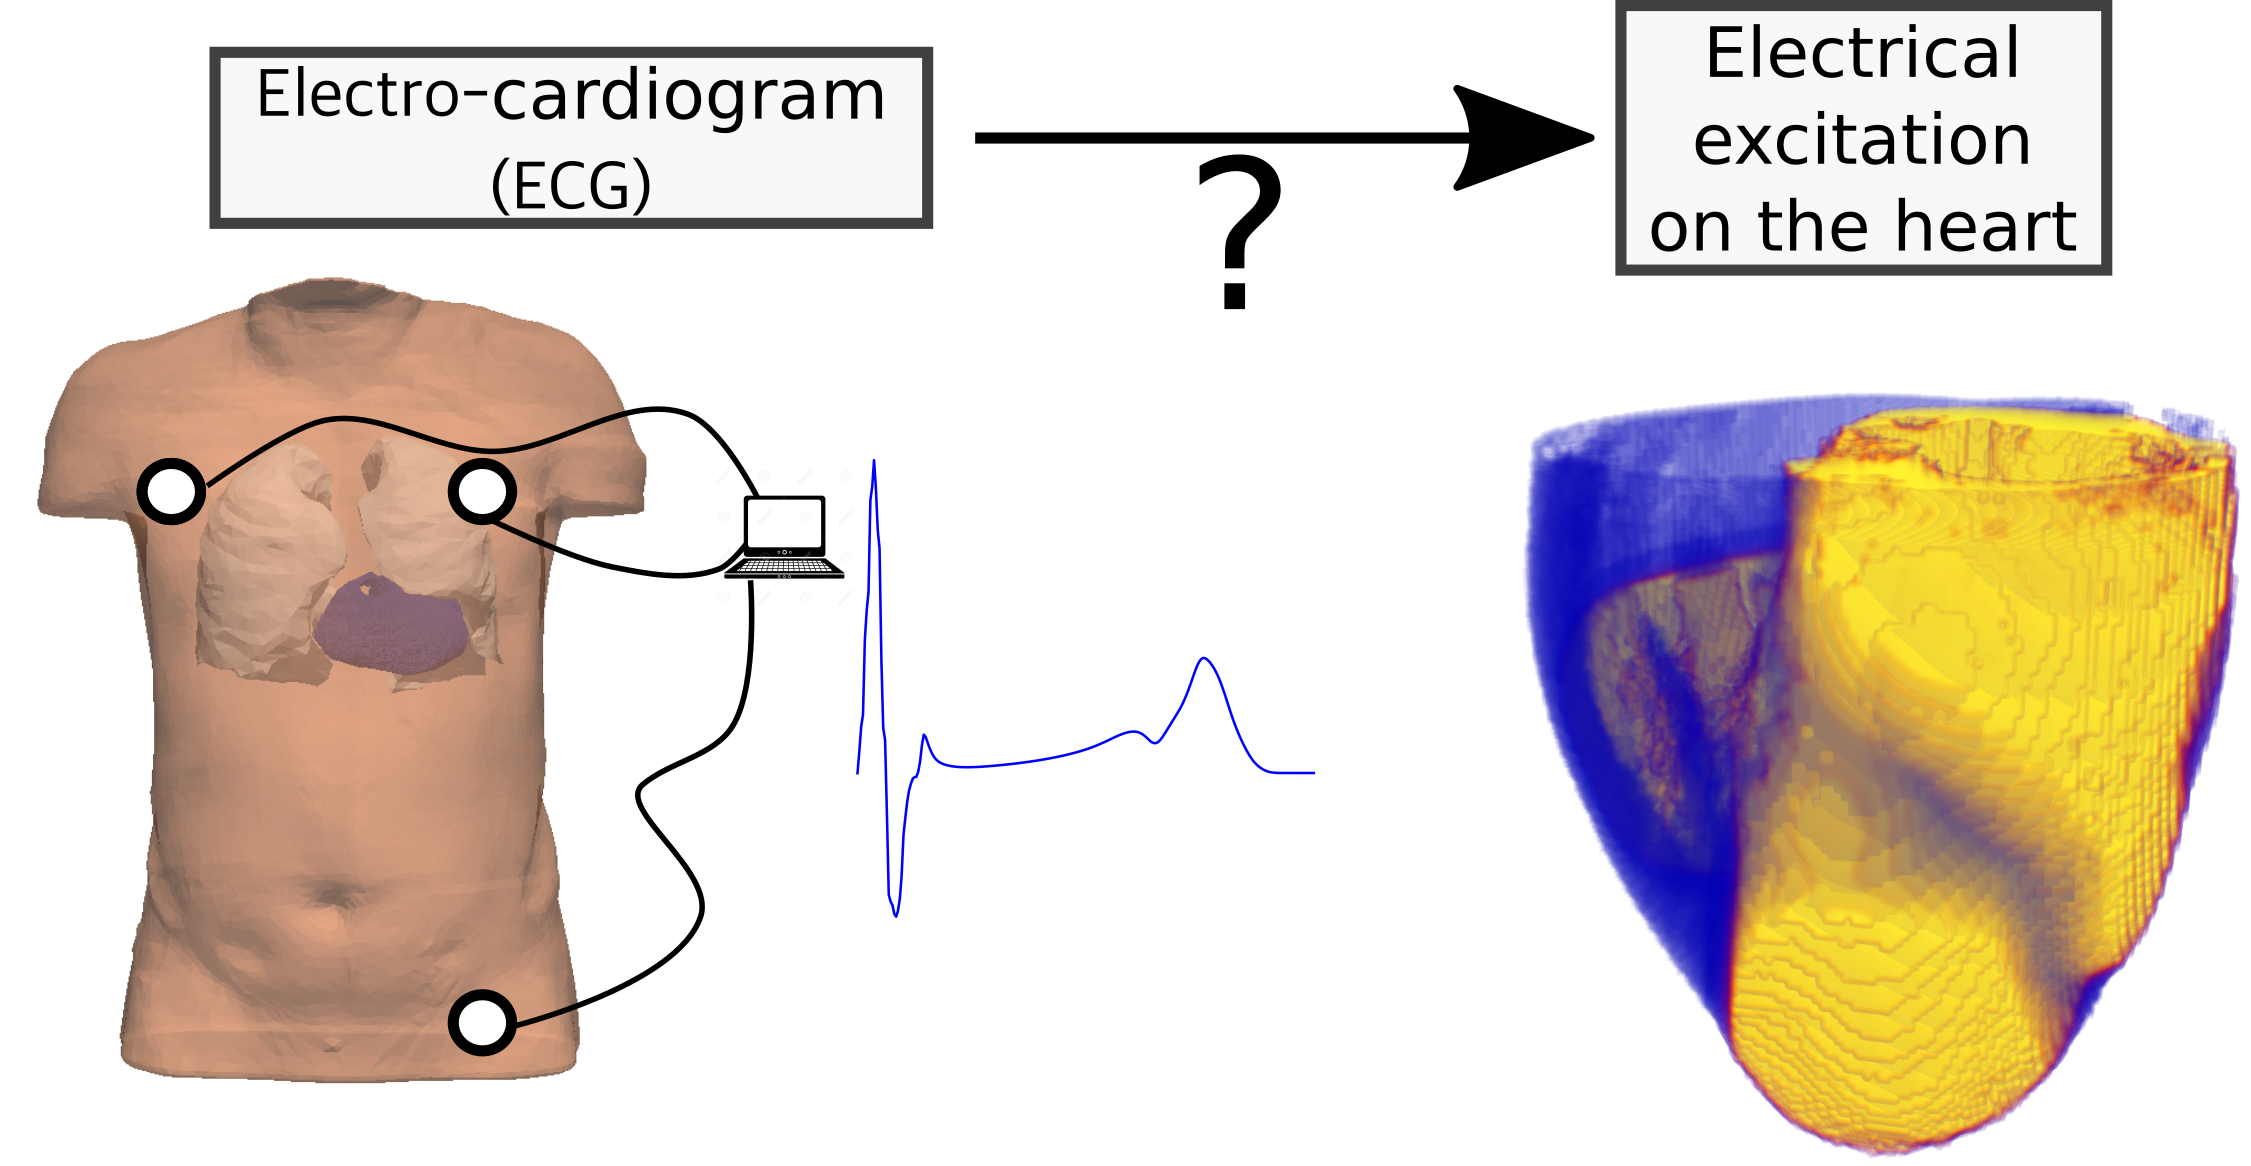
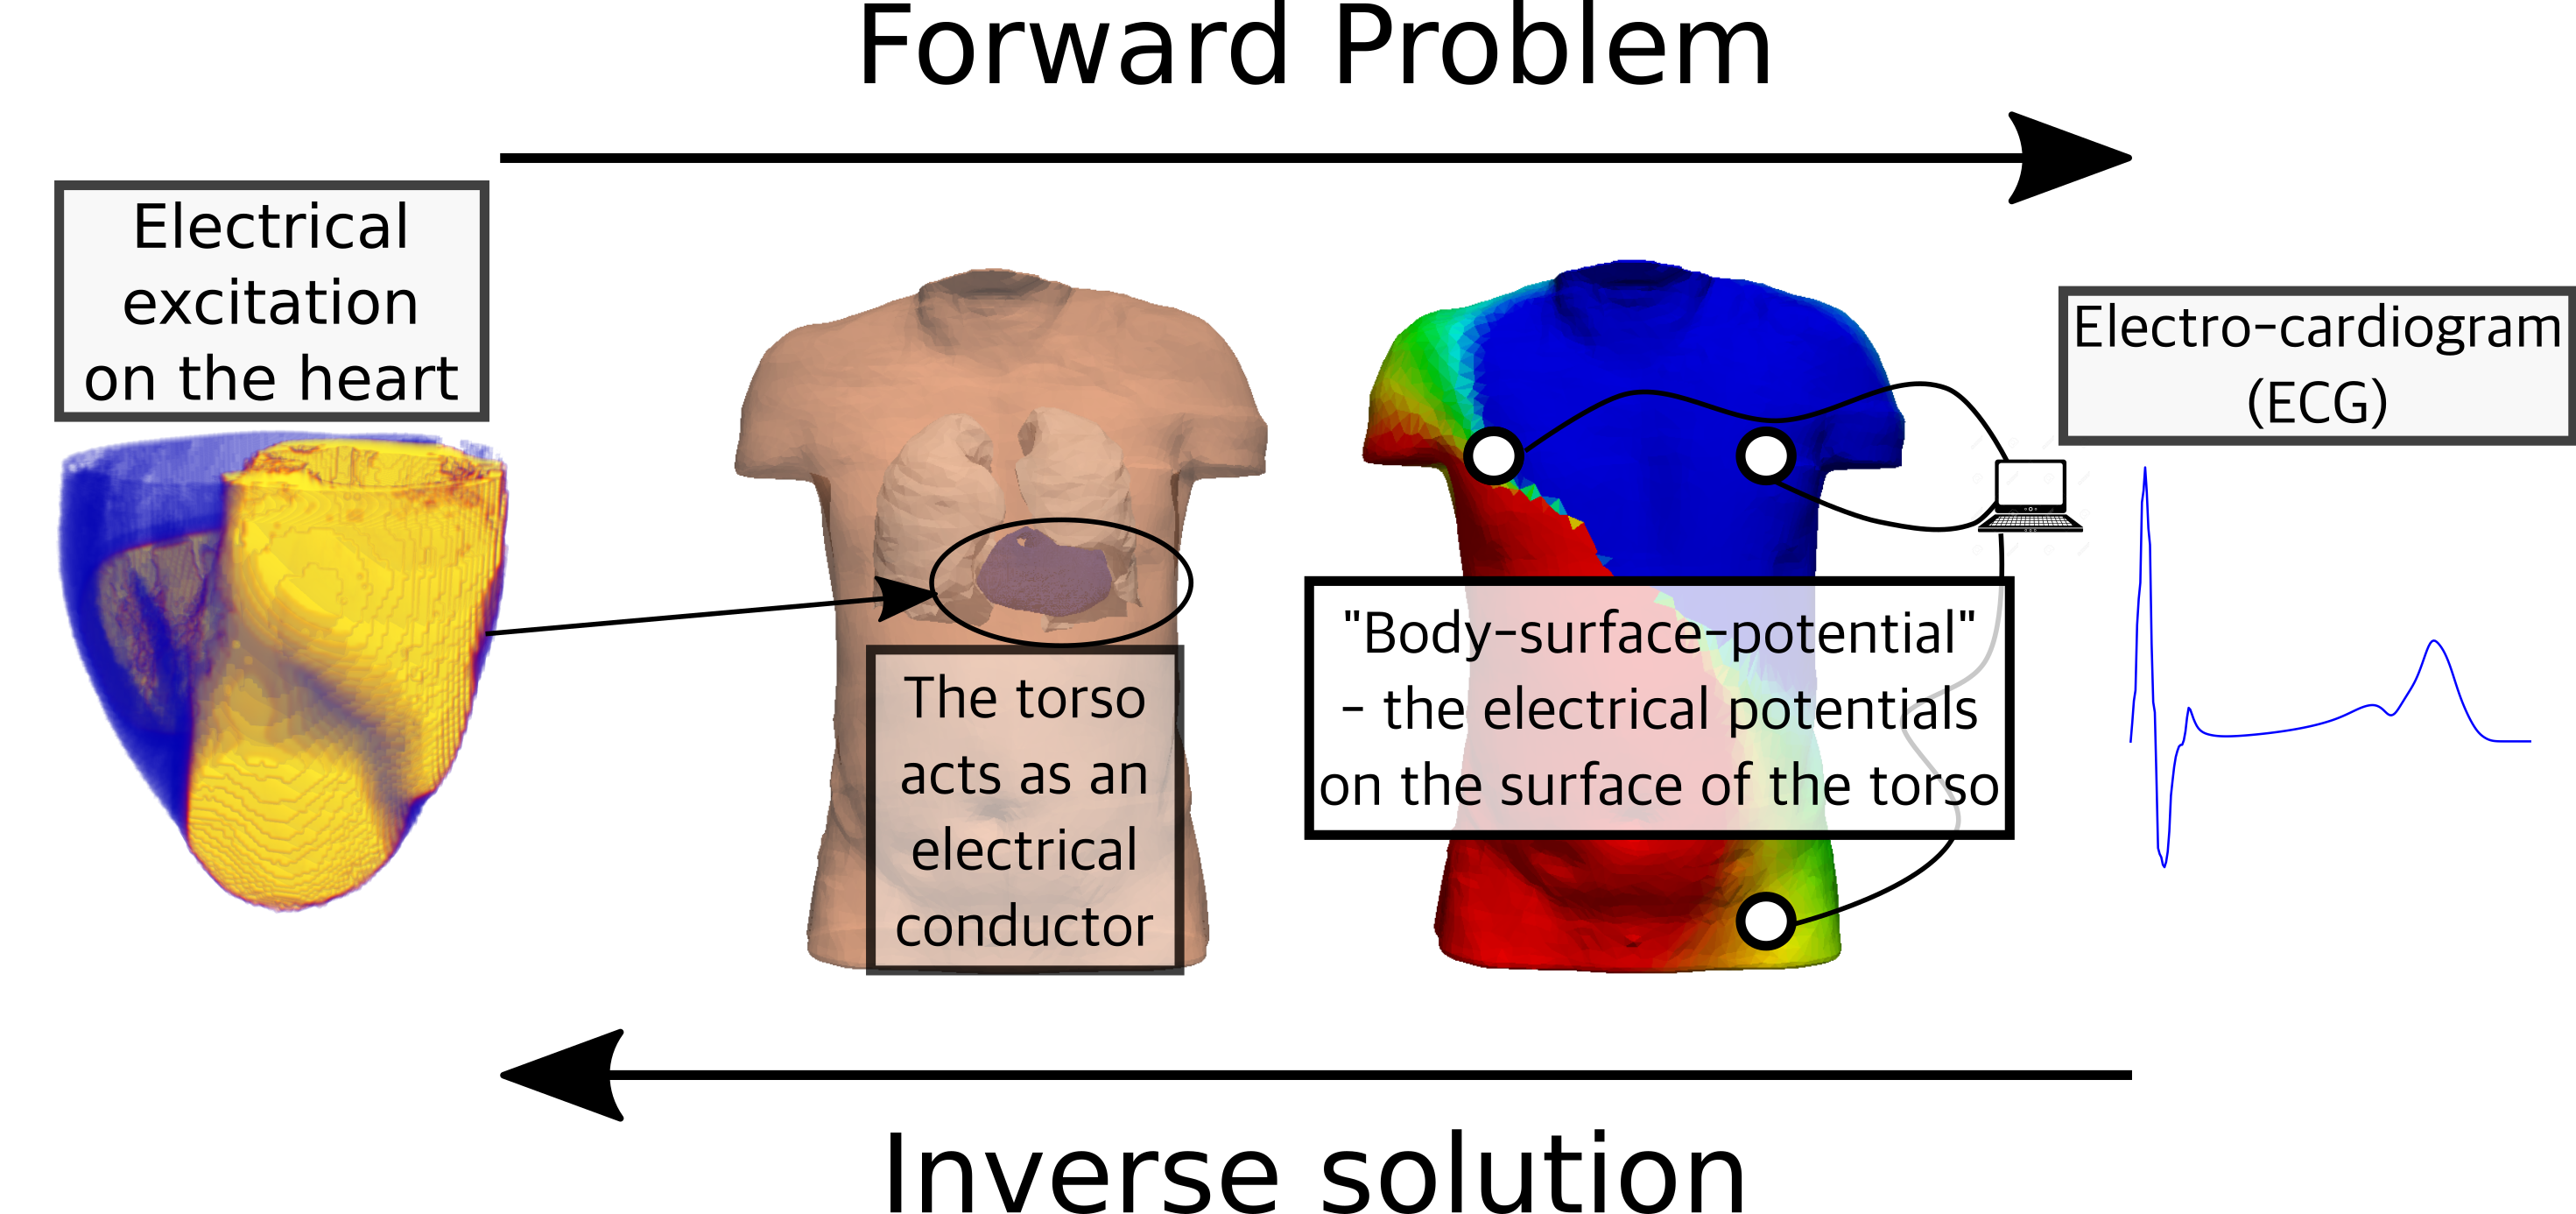
Illustration of the concepts of the Forward Problem and Inverse Solution. The Forward Problem attemtps to predict the Body Surface Potential resulting from the electrical activity of the heart; the Inverse Solution attempts to reconstruct the electrical activity of the heart from knowledge about the Body Surface Potential.

The body-surface potential (BSP) is an attenuated signal that corresponds to the electric field resulting from the changing electrical excitation state on the surface of the heart. It is described by the forward problem which provides a calculation for the BSP based on the electrical pattern on the heart. We work on two aspects of these non-invasive mapping approaches: 1) correlating the morphology of ECG waveforms with the heart conduction patterns; 2) reconstructing the electrical patterns on the heart from the BSP measurements, called the inverse problem.

Primarily led by Erick Perez Alday, we investigate these by using a combination of experimental and computational approaches. Computer modelling can be used to predict the BSP by solving the forward problem or to provide the inverse solution and thus a complete map of the heart. Computer simulations offer a specific advantage in this field: it is trivial to simultaneously correlate both BSP and cardiac excitation, something which is very challenging otherwise. However, matching simulations with experiment is not easy, and there is significant work still to be performed.


Solving the forward problem

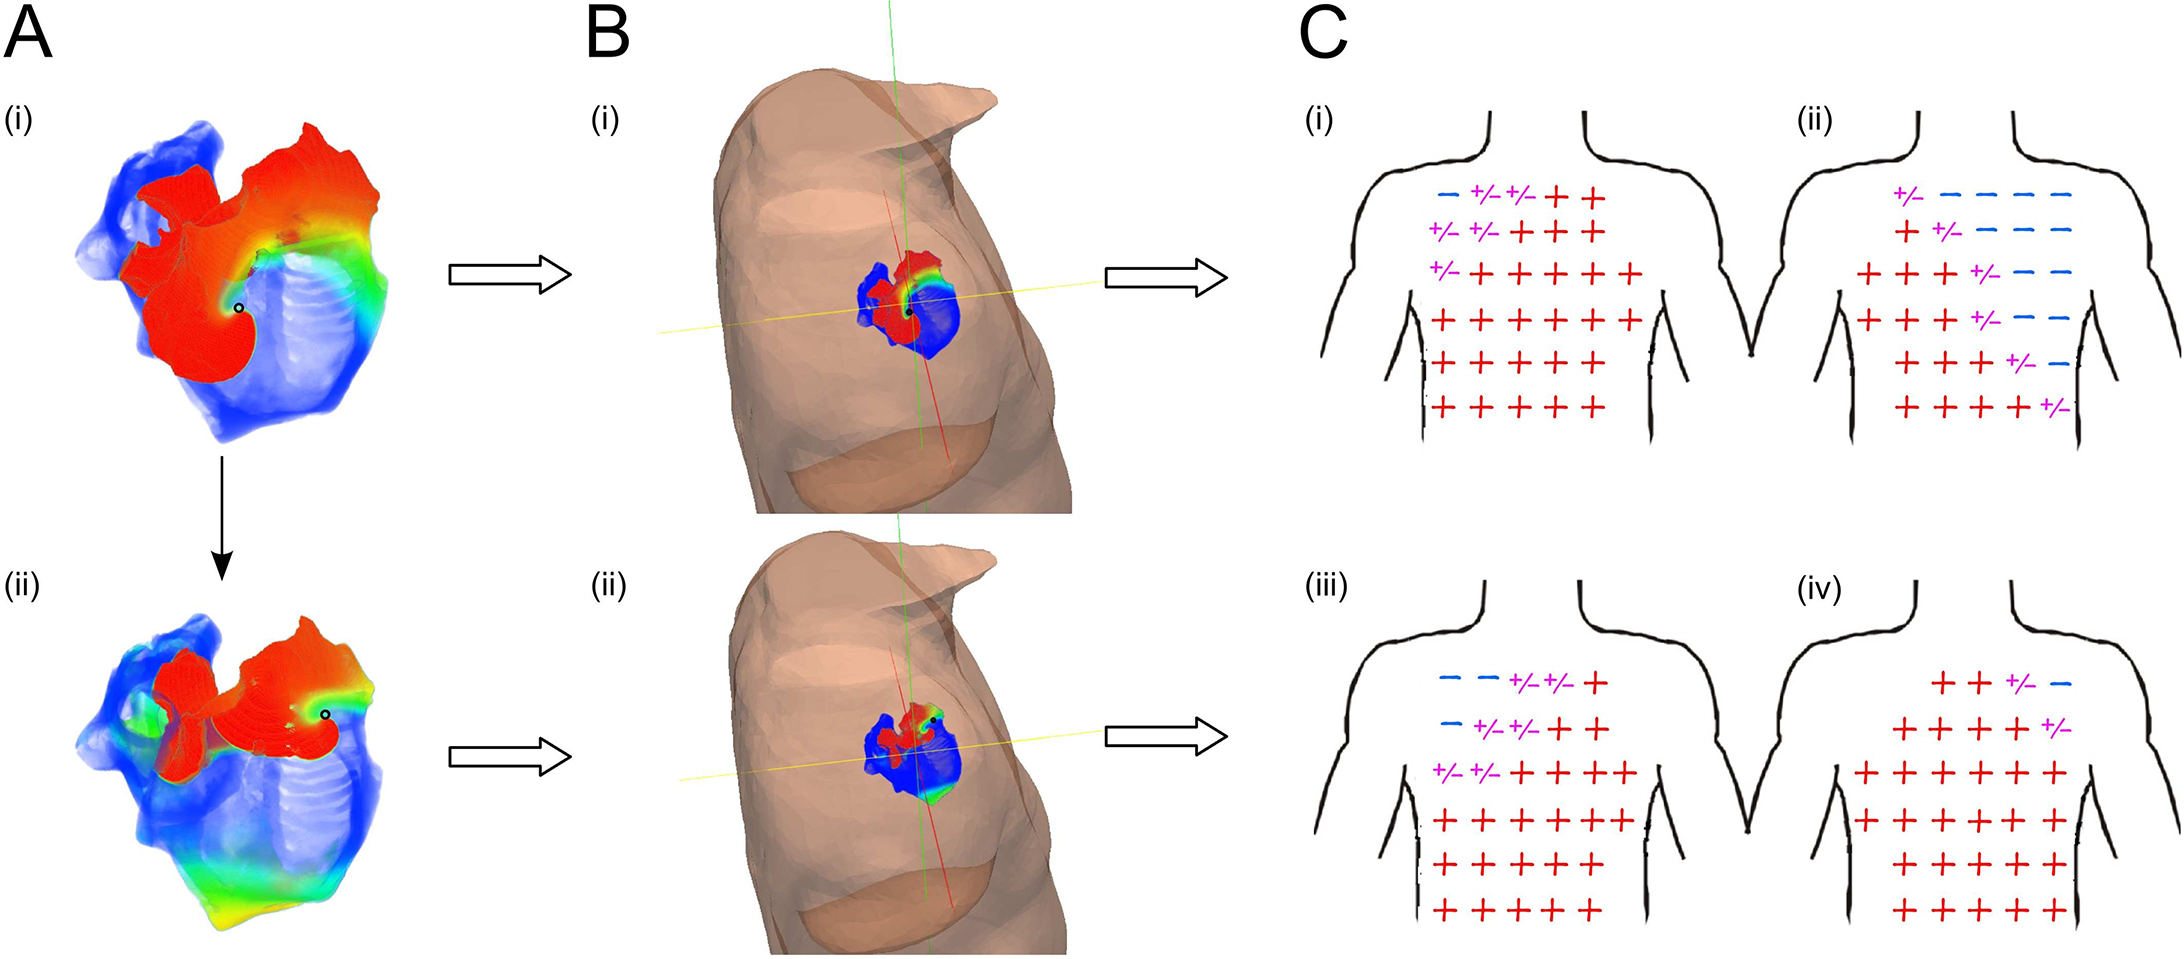
Figure: Illustration of the correlation between the source of excitation in the atria and the polarity (orientation) of the P-wave at different locations on the body. Image and data from Perez Alday et al. 2017. PLOS Comp. Biol.

In a short series of papers, simulations were used to correlate the polarity (orientation) of P-waves recorded at different locations in the body with the location of the source of electrical excitation during abnormal atrial pacing.

These correlations were used to develop algorithms which return a predicted source-location from a given set of ECG measurements. Such information can potentially significantly reduce surgery time as well as provide early diagnostic information. We also developed a method to distinguish rapid pacing from re-entrant excitation patterns, which may be critical for pharmacological management as these two types of excitation are driven by different mechanisms.

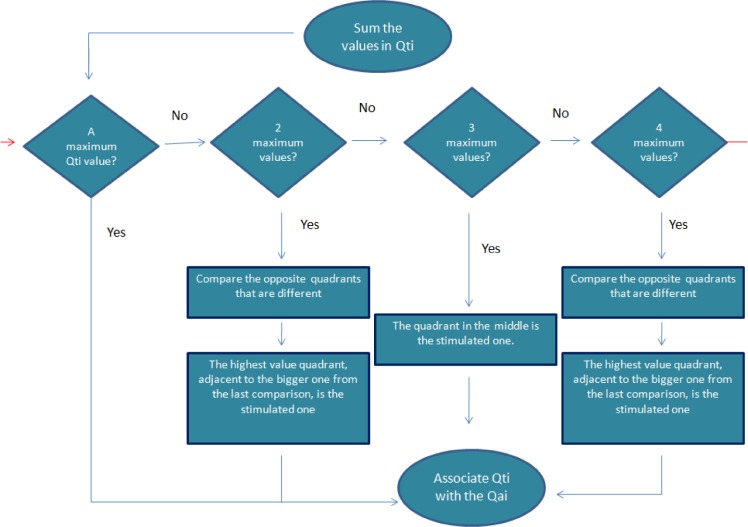
Figure: Algorithm to correlate ECG P-wave morphology with the source-location on the heart. Image and data from Perez Alday et al. 2015. PLOS Comp. Biol.

Related publications

[13] Perez Alday EA, Colman MA , Langley P, Zhang H. "Novel non-invasive algorithm to identify the origins of re-entry and ectopic foci in the atria from 64-lead ECGs: A computational study" PLOS Comp. Bio. 2017
[10] Perez Alday EA, Ni H, Zhang C, Colman MA , Gan Z, Zhang H. "Comparison of Eletric- and Magnetic- Cardiograms Produced by Myocardial Ischemia in Models of the Human Ventricle and Torso" PLOS Comp. Bio. 2016, 11, e01609999
[9] Perez Alday EA, Colman MA , Langley P, Butters TD, Higham J, Workman AJ, Hancox JC, Zhang H.
"A new algorithm to diagnose atrial ectopic origin from multi-lead ECG systems" PLOS Comp. Bio. 2014, 11, e1004026

Inverse solutions

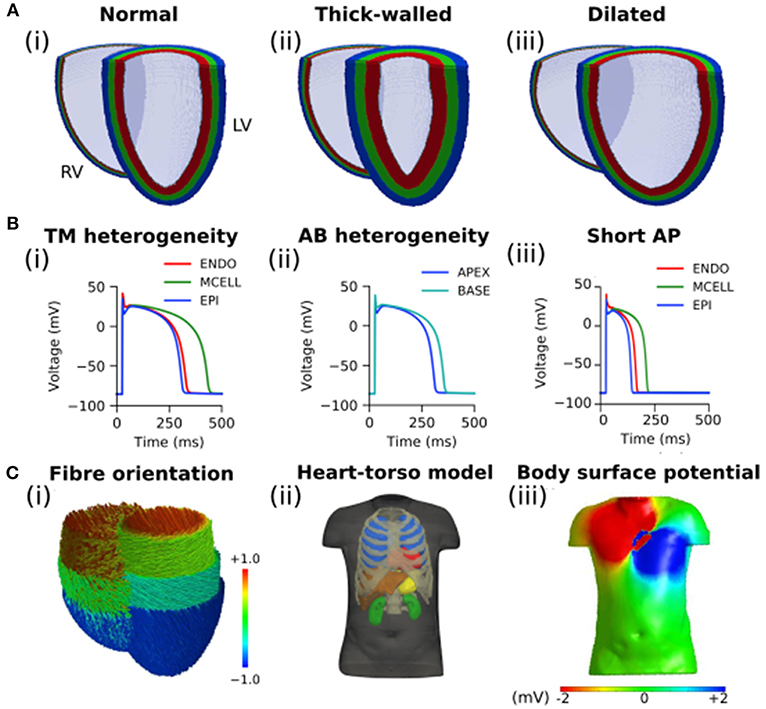
Figure: Models used to simulate the impact of heart size on the reconstructed potential maps. Image and data from Perez Alday et al. 2019. Front. Physiol

These approaches attempt to directly reconstruct the electrical pattern on the heart using the limited information available from the BSP. In this paper, we used simulations to determine the extent to which errors in the geometrical representation of the heart would lead to errors in the reconstructed excitation patterns. This also revealed a mechanism by which the extent of the errors depended on the pacing rate, indicating that at more rapid rates (those associated with rapid arrhythmias) the errors induced were larger.

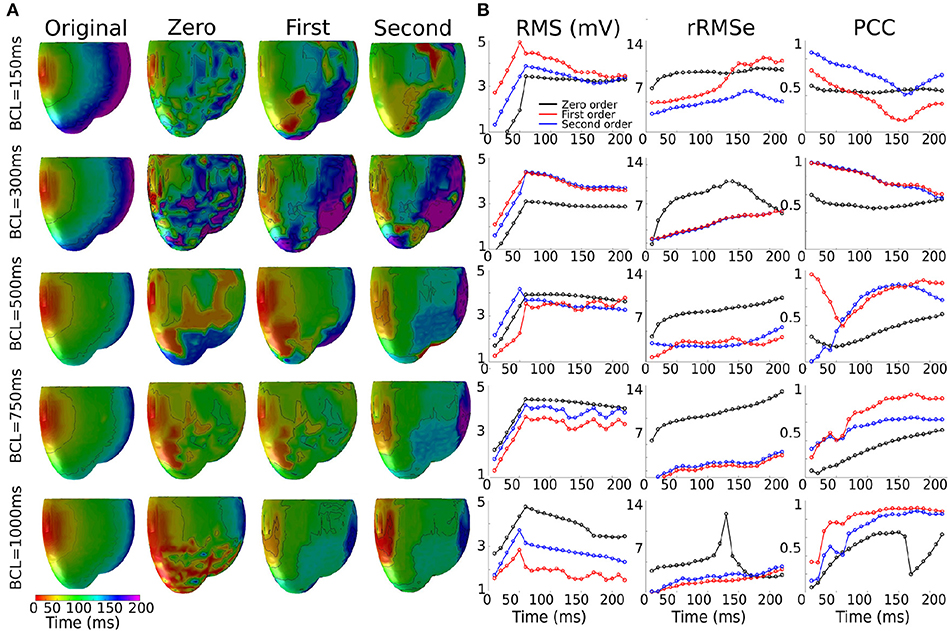
Figure: Extent of the errors and correlations over the course of ventricular activation at different pacing rates. Image and data from Perez Alday et al. 2019. Front. Physiol

Related publications

[21] Perez Alday EA, Whittaker DG, Benson AP and Colman MA. "Effects of Heart Rate and Ventricular Wall Thickness on Non-invasive Mapping: An in silico Study". Front. Physiol., 05 April 2019.