Concept: The Action Potential
Cardiac cells are encased by a cell membrane. Differences in the concentration of
charged particles (called ions) inside and outside the
cell result in a membrane potential - a difference in electric potential
across the membrane. The Action Potential refers to the change in this membrane potential
during excitation, illustrated below.
 Animation: The Action Potential. Left panel shows a schematic of a cell with different types
of ion and the channels which allow them to pass (coloured circles and channels), and the
right panel shows the membrane potential at different stages of the Action Potential.
Animation: The Action Potential. Left panel shows a schematic of a cell with different types
of ion and the channels which allow them to pass (coloured circles and channels), and the
right panel shows the membrane potential at different stages of the Action Potential.
As ions flow through these ion channels, the movement of charge creates ionic currents which can change the membrane potential. Because the opening and closing of ion channels can also be controlled by the membrane potential, the currents can be coordinated to create the shape of the Action Potential.
There are multiple types of ion channel, each associated with specific ions (sodium, potassium, calcium and others).
"Inward" currents are those where positive charge enters the cell (yellow and red in the animation) - they make the membrane potential more positive, which we call “depolarisation”: Larger inward currents generally mean greater excitability and longer durations of the Action Potential.
"Outward" currents are those where positive charge leaves the cell (blue in the animation) – they make the membrane potential more negative, which we call "repolarisation": Larger outward currents generally mean lower excitability and shorter duration.
The balance of multiple different currents, controlled by the expression (amount of) each type of ion channel, can therefore control Action Potentials with different shapes and properties to match the varying requirements of cardiac function in different animals and under different conditions (e.g. rest versus exercise).
 Animation: The intracellular Ca2+ handling cycle. Left panel shows a schematic of the cellular
components involved in Ca2+ handling: the surface membrane and T-tubules (TT); the intracellular
Ca2+ store called the Sarcoplasmic Reticulum (SR; blue-green); the contractile proteins (myofilaments); the
Ca2+ carrying flux channels responsible for the initial influx (red), intracellular Ca2+
release (blue), SR refilling (yellow) and Ca2+ extrusion (green). Arrows indicate the timing and direction
of fluxes. Green areas indicate high Ca2+ concentration.
The right panel shows the Action Potential (blue) and whole-cell Ca2+ transient (orange)
at each phase.
Animation: The intracellular Ca2+ handling cycle. Left panel shows a schematic of the cellular
components involved in Ca2+ handling: the surface membrane and T-tubules (TT); the intracellular
Ca2+ store called the Sarcoplasmic Reticulum (SR; blue-green); the contractile proteins (myofilaments); the
Ca2+ carrying flux channels responsible for the initial influx (red), intracellular Ca2+
release (blue), SR refilling (yellow) and Ca2+ extrusion (green). Arrows indicate the timing and direction
of fluxes. Green areas indicate high Ca2+ concentration.
The right panel shows the Action Potential (blue) and whole-cell Ca2+ transient (orange)
at each phase.
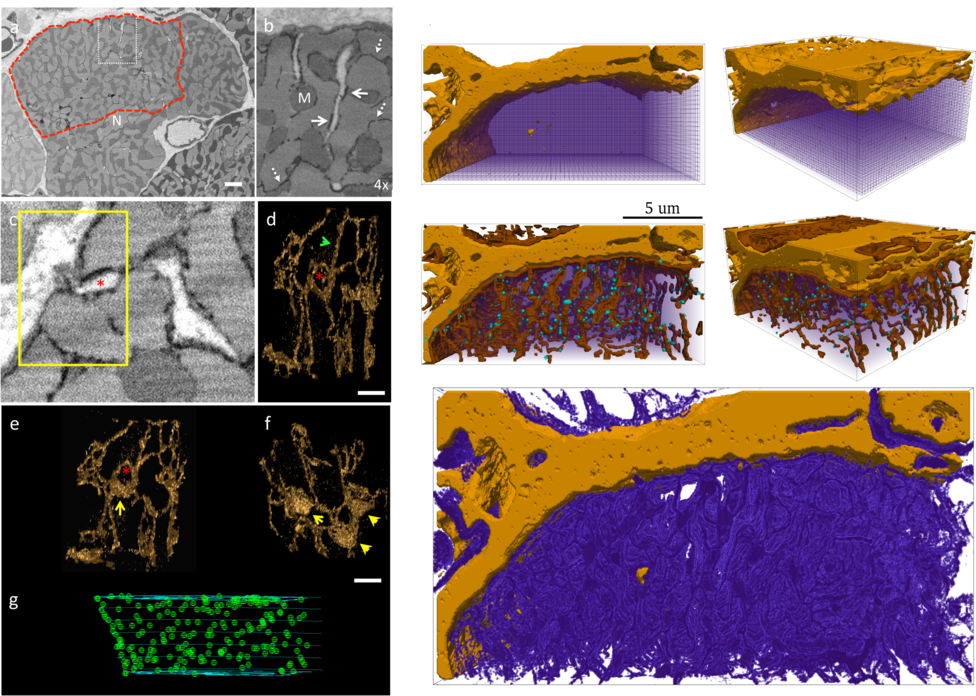 Figure: Electron-microscope images of intracellular cardiac structure (left), with 3D
reconstructions of the intracellular Ca2+
store (the network like structure; lower panels) and locations of the sites of
calcium-induced-calcium-release (green dots; lower panels).
Reconstructions of these structures in a portion of the cell for computational simulation
are shown on the right. The upper panels show the surface membrane and
its protrusions into the cell interior, with the locations of the sites of calcium-induced-calcium
release (blue dots); the lower panel shows
the reconstruction of the intracellular Ca2+store. Data and images from
Figure: Electron-microscope images of intracellular cardiac structure (left), with 3D
reconstructions of the intracellular Ca2+
store (the network like structure; lower panels) and locations of the sites of
calcium-induced-calcium-release (green dots; lower panels).
Reconstructions of these structures in a portion of the cell for computational simulation
are shown on the right. The upper panels show the surface membrane and
its protrusions into the cell interior, with the locations of the sites of calcium-induced-calcium
release (blue dots); the lower panel shows
the reconstruction of the intracellular Ca2+store. Data and images from
 Animation: Simulation of normal cardiac exciation in the 3D cell model. The traces on the left show the
membrane potential (upper) and whole-cell average
Ca2+ in the bulk intracellular space (middle) and the intracellular store (lower). Spatial
dynamics are shown for the bulk intracellular
space (centre panels; purple-green-yellow indicates low-high concentrations of Ca2+)
and intracellullar store (right panels; purple-orange-yellow
indicates low-high concentrations). Data and video from
Animation: Simulation of normal cardiac exciation in the 3D cell model. The traces on the left show the
membrane potential (upper) and whole-cell average
Ca2+ in the bulk intracellular space (middle) and the intracellular store (lower). Spatial
dynamics are shown for the bulk intracellular
space (centre panels; purple-green-yellow indicates low-high concentrations of Ca2+)
and intracellullar store (right panels; purple-orange-yellow
indicates low-high concentrations). Data and video from
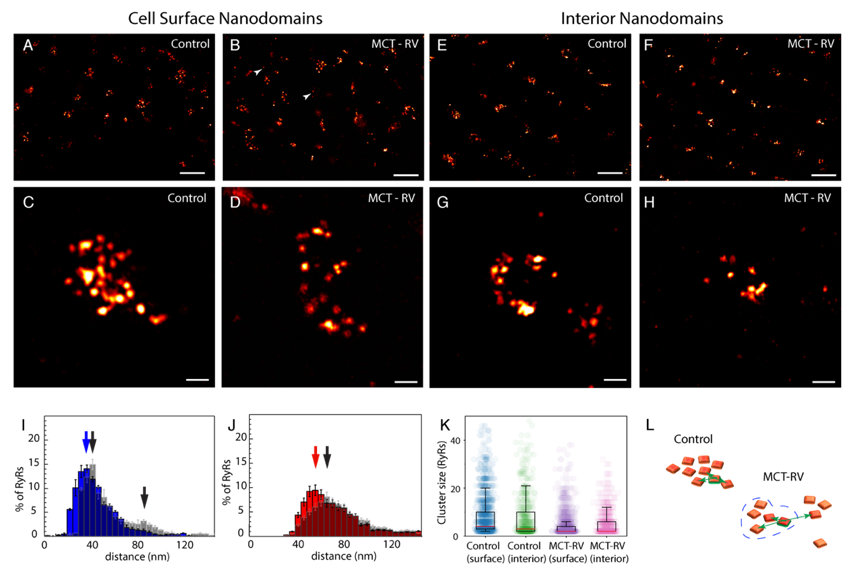 Figure: Imaging the proteins responsible for calcium-induced-calcium-release using 10x
expansion microscopy. Panels A-H
are different examples of clusters of these proteins in control and a model of heart failure
(termed "MCT" in the figure). I-K summarise analysis of
cluster size in the different conditions, and L illustrates the differences between the two
conditions. Data and images from
Figure: Imaging the proteins responsible for calcium-induced-calcium-release using 10x
expansion microscopy. Panels A-H
are different examples of clusters of these proteins in control and a model of heart failure
(termed "MCT" in the figure). I-K summarise analysis of
cluster size in the different conditions, and L illustrates the differences between the two
conditions. Data and images from
 Animation: triggered calcium Ca2+ sparks in single dyads in control and heart failure (MCT),
with and without phosphorylation. The geometries for single RyRs were based on experimental reconstructions.
In Heart Failure, the robustness of triggered sparks (the consistency with which they can be induced) was
significantly lost.
Animation and data from
Animation: triggered calcium Ca2+ sparks in single dyads in control and heart failure (MCT),
with and without phosphorylation. The geometries for single RyRs were based on experimental reconstructions.
In Heart Failure, the robustness of triggered sparks (the consistency with which they can be induced) was
significantly lost.
Animation and data from 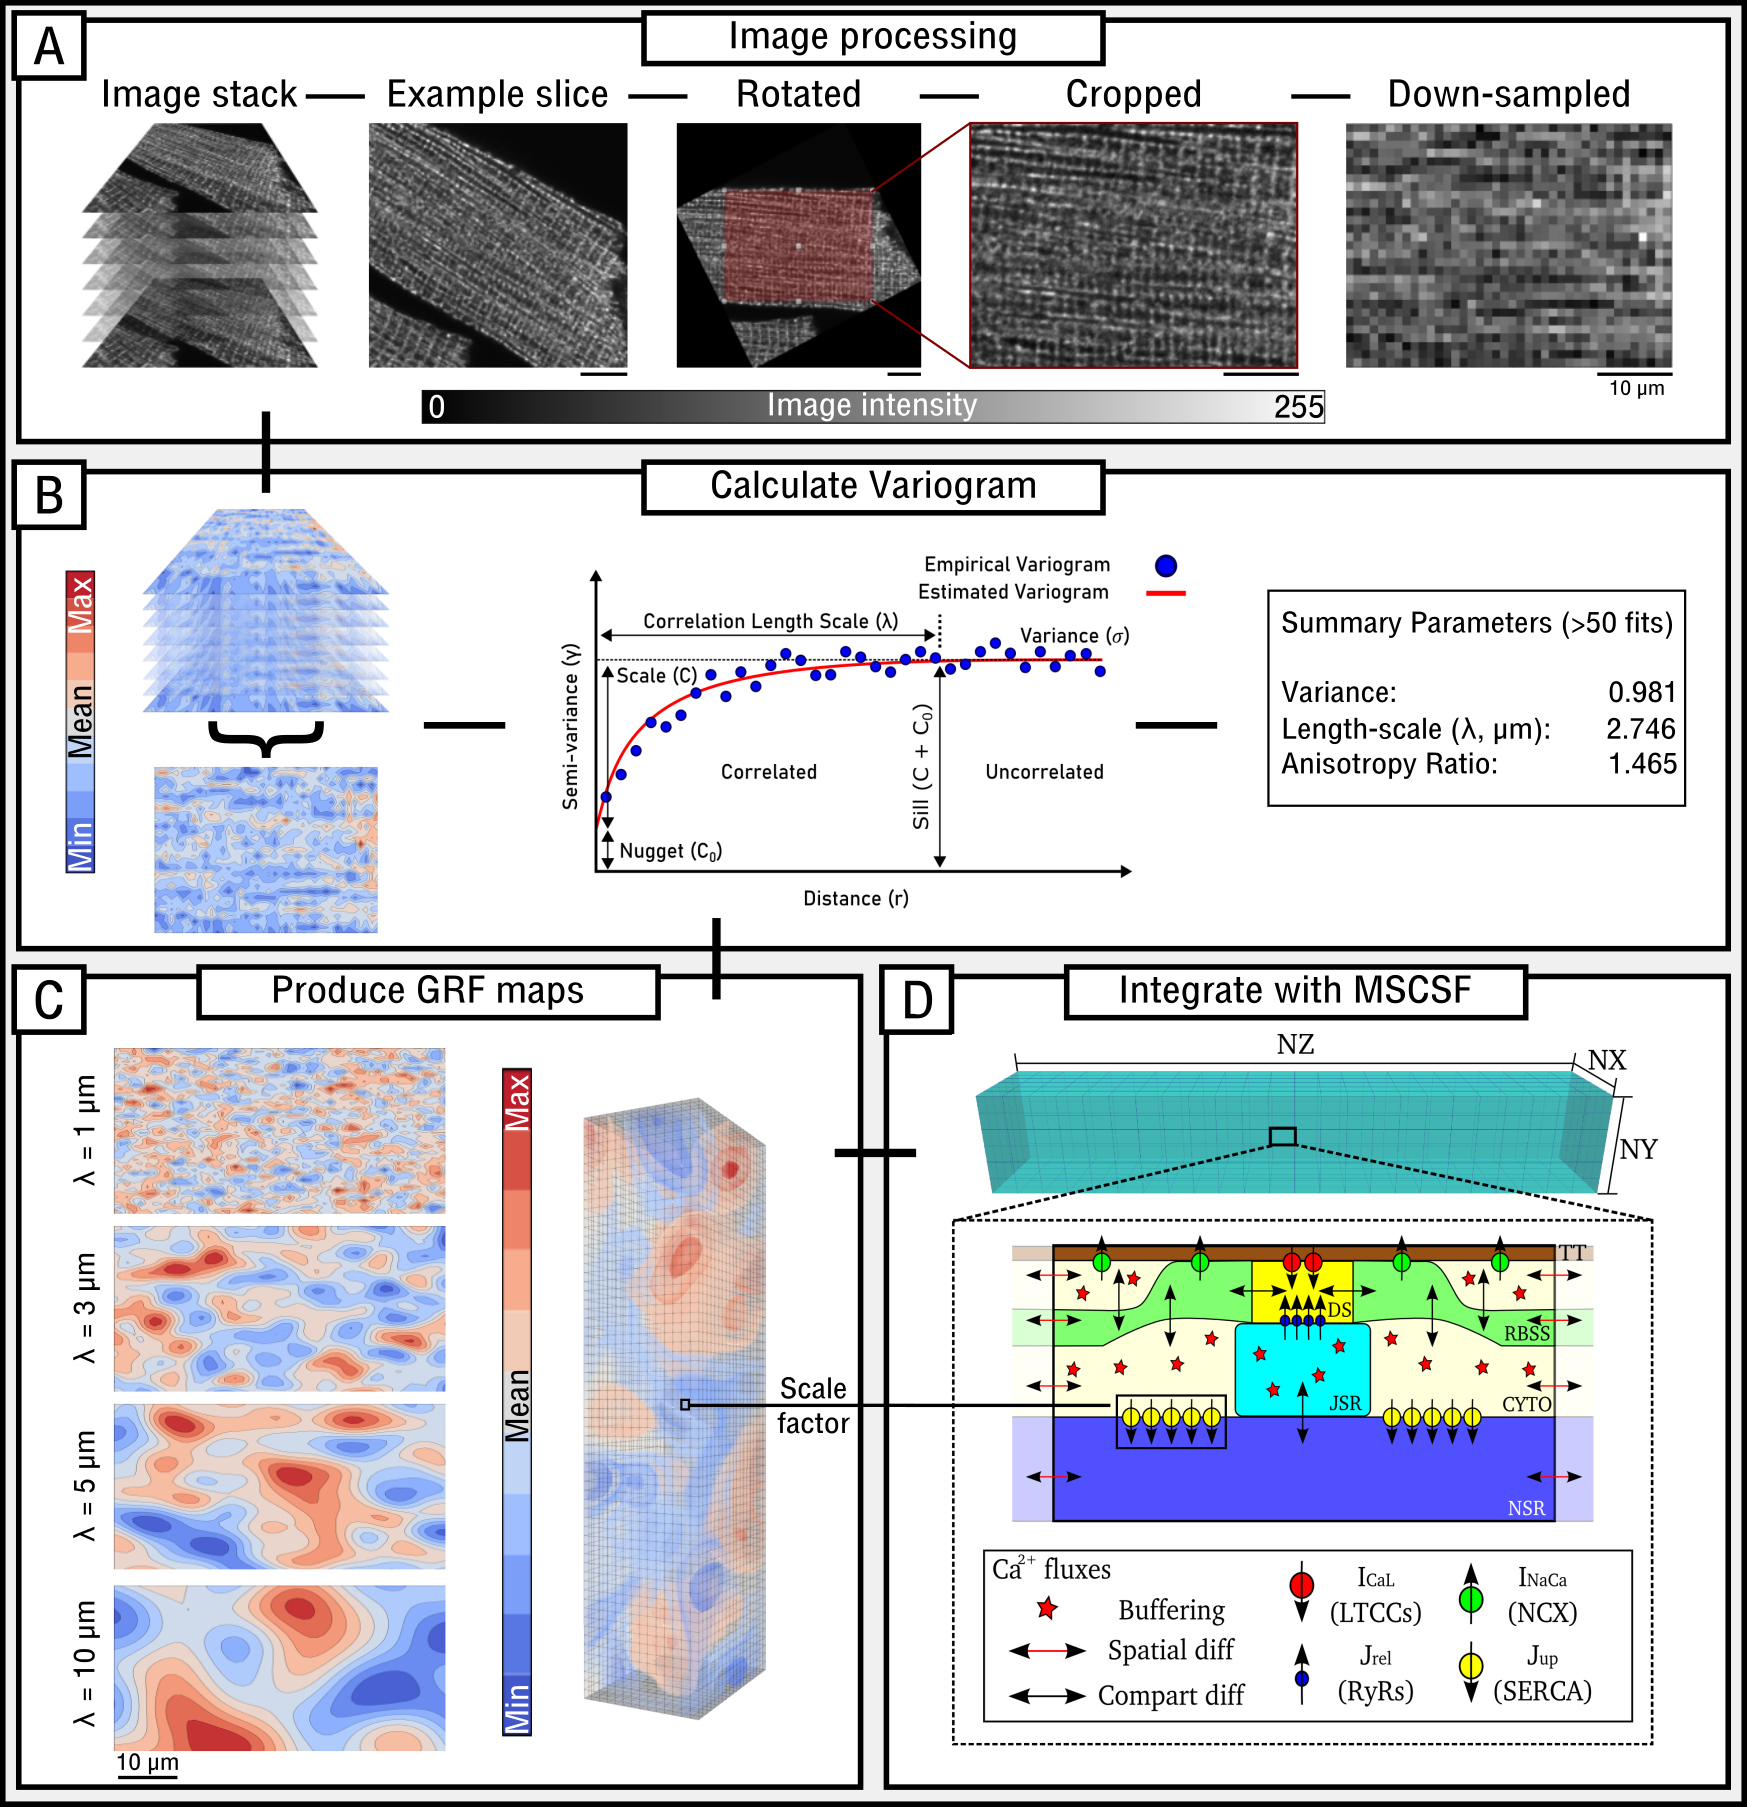 Figure: Image-analysis pipeline, illustrating quantification of length-scale, the production of Gaussian Random Field maps,
and method to simulate heterogeneity in a channel.
Figure: Image-analysis pipeline, illustrating quantification of length-scale, the production of Gaussian Random Field maps,
and method to simulate heterogeneity in a channel.
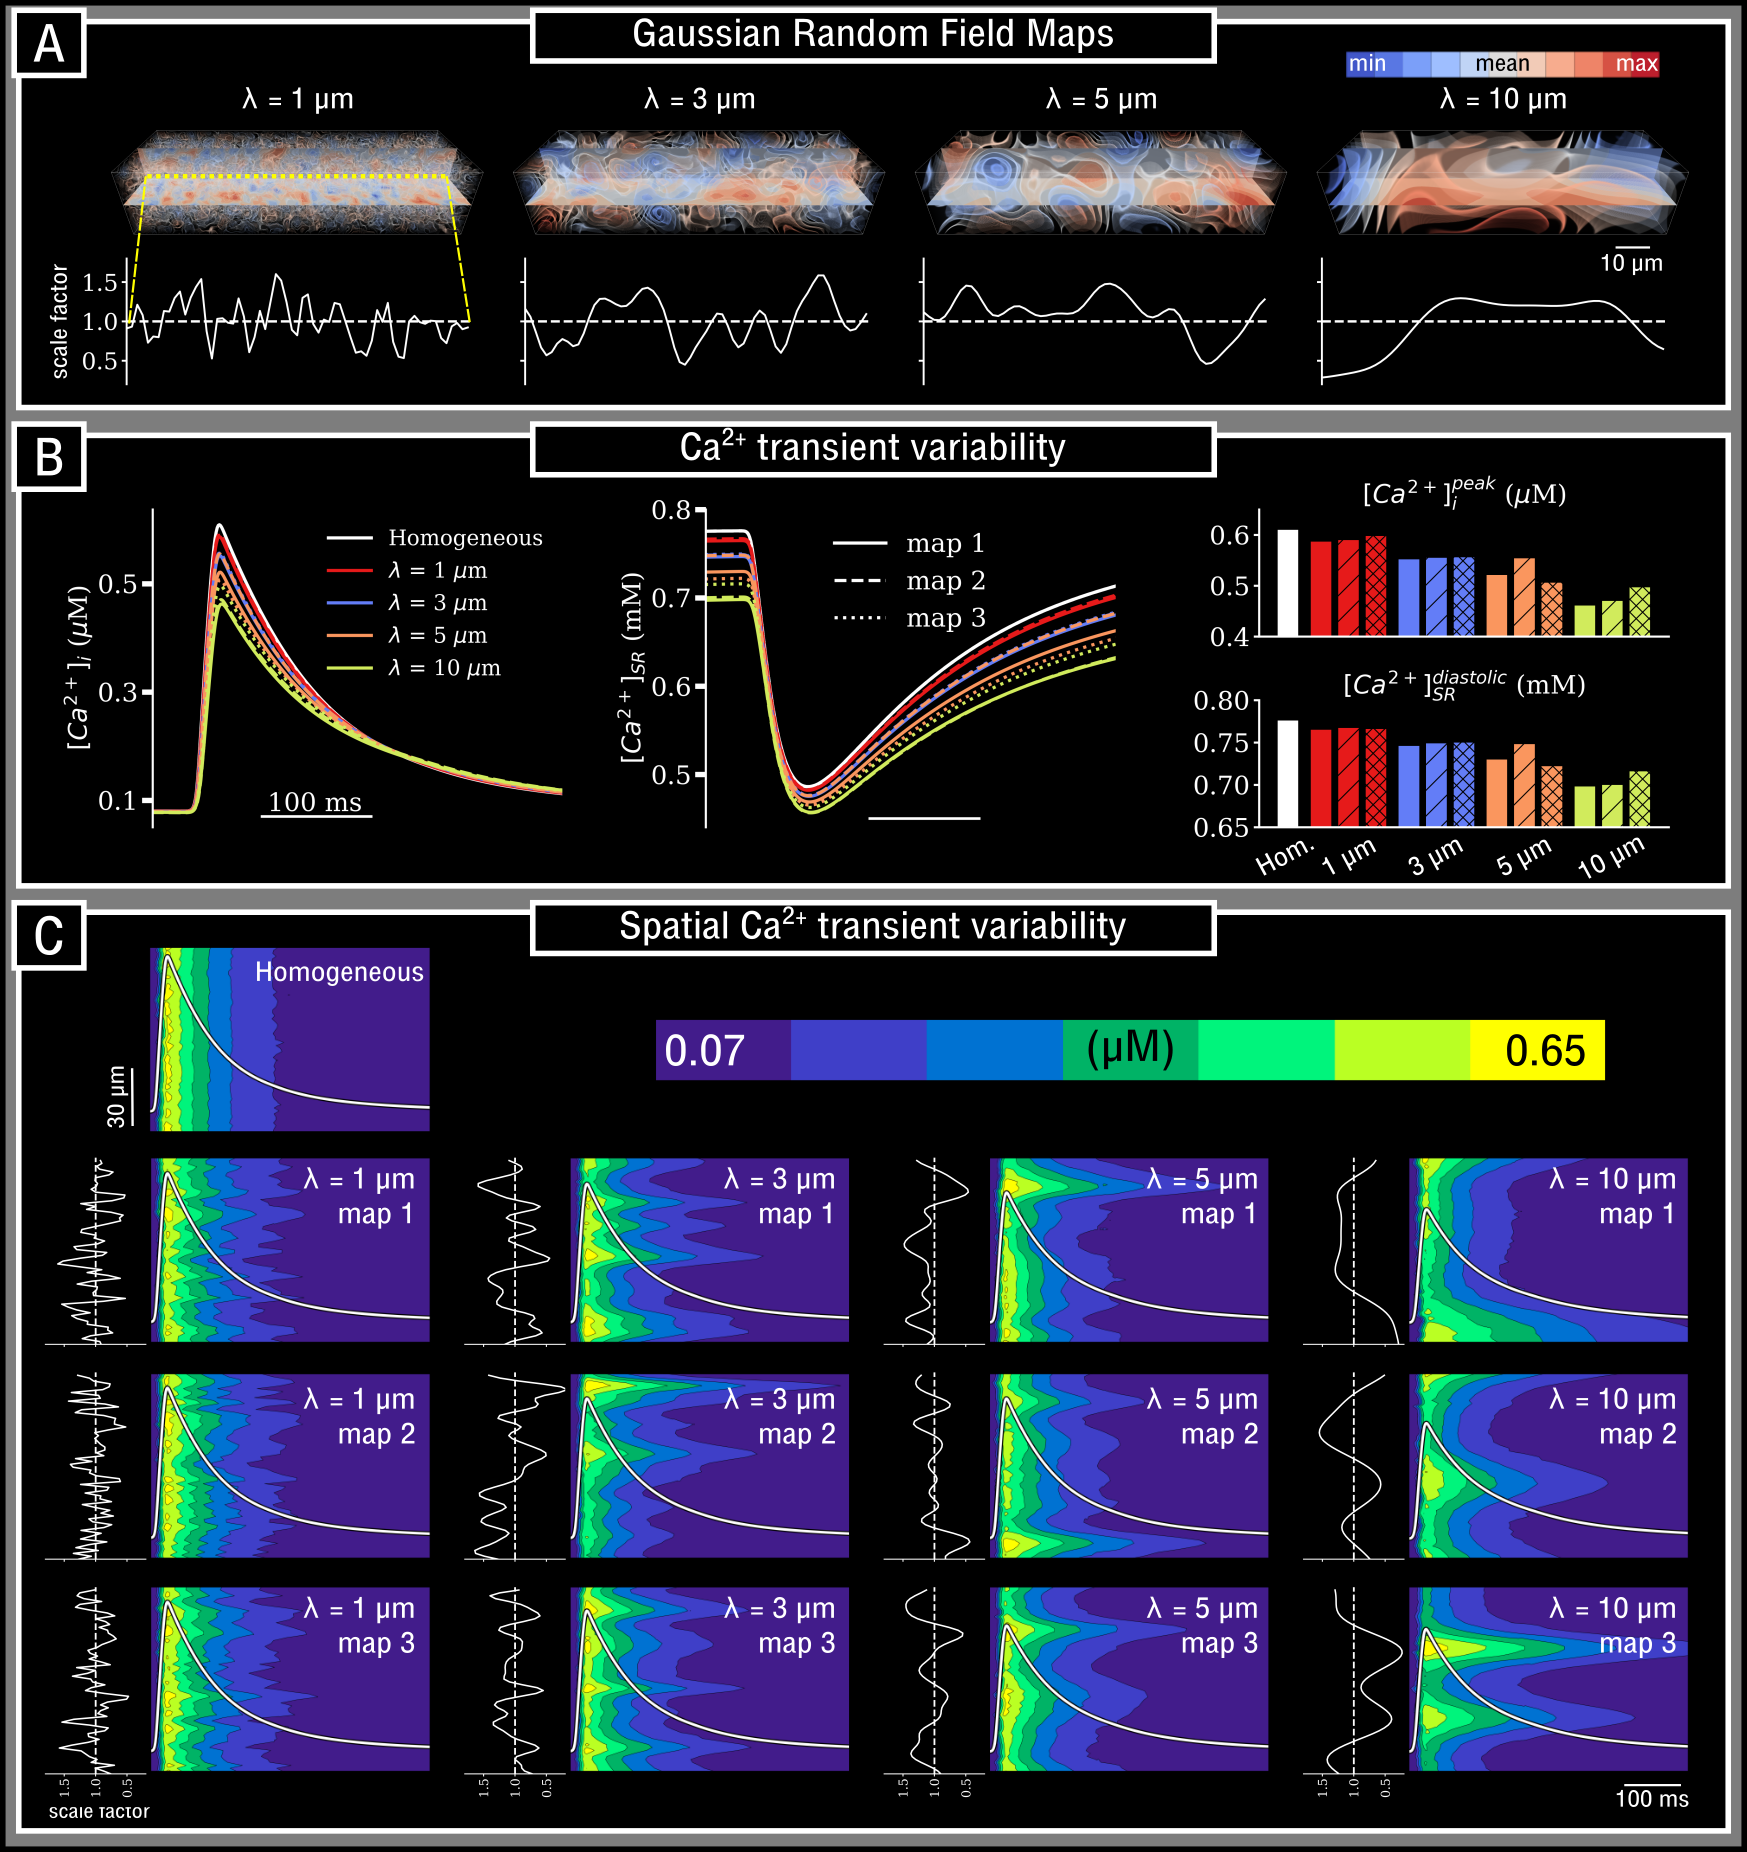 Figure: Variability in the intracellular calcium transient as a consequence of heterogeneity in SERCA expression at different length-scales.