Concept: The Action Potential
Cardiac cells are encased by a cell membrane. Differences in the concentration of
charged particles (called ions) inside and outside the
cell result in a membrane potential - a difference in electric potential
across the membrane. The Action Potential refers to the change in this membrane potential
during excitation, illustrated below.
Animation: The Action Potential. Left panel shows a schematic of a cell with different types of ion and the channels which allow them to pass (coloured circles and channels), and the right panel shows the membrane potential at different stages of the Action Potential.
Ions can cross the cell membrane through specialised proteins (called ion channels), which can open or close to allow or prevent the passage of ions.As ions flow through these ion channels, the movement of charge creates ionic currents which can change the membrane potential. Because the opening and closing of ion channels can also be controlled by the membrane potential, the currents can be coordinated to create the shape of the Action Potential.
There are multiple types of ion channel, each associated with specific ions (sodium, potassium, calcium and others).
"Inward" currents are those where positive charge enters the cell (yellow and red in the animation) - they make the membrane potential more positive, which we call “depolarisation”: Larger inward currents generally mean greater excitability and longer durations of the Action Potential.
"Outward" currents are those where positive charge leaves the cell (blue in the animation) – they make the membrane potential more negative, which we call "repolarisation": Larger outward currents generally mean lower excitability and shorter duration.
The balance of multiple different currents, controlled by the expression (amount of) each type of ion channel, can therefore control Action Potentials with different shapes and properties to match the varying requirements of cardiac function in different animals and under different conditions (e.g. rest versus exercise).
 Animation: The intracellular Ca2+ handling cycle. Left panel shows a schematic of the cellular
components involved in Ca2+ handling: the surface membrane and T-tubules (TT); the intracellular
Ca2+ store called the Sarcoplasmic Reticulum (SR; blue-green); the contractile proteins (myofilaments); the
Ca2+ carrying flux channels responsible for the initial influx (red), intracellular Ca2+
release (blue), SR refilling (yellow) and Ca2+ extrusion (green). Arrows indicate the timing and direction
of fluxes. Green areas indicate high Ca2+ concentration.
The right panel shows the Action Potential (blue) and whole-cell Ca2+ transient (orange)
at each phase.
Animation: The intracellular Ca2+ handling cycle. Left panel shows a schematic of the cellular
components involved in Ca2+ handling: the surface membrane and T-tubules (TT); the intracellular
Ca2+ store called the Sarcoplasmic Reticulum (SR; blue-green); the contractile proteins (myofilaments); the
Ca2+ carrying flux channels responsible for the initial influx (red), intracellular Ca2+
release (blue), SR refilling (yellow) and Ca2+ extrusion (green). Arrows indicate the timing and direction
of fluxes. Green areas indicate high Ca2+ concentration.
The right panel shows the Action Potential (blue) and whole-cell Ca2+ transient (orange)
at each phase.

 Animation: Ca2+ transient alternans in a model cell with realistic structure.
Only a portion of the cell is shown for clarity. Left panels show the intracellular (upper) and sarcoplasmic
reticulum (lower) whole-cell average concentrations; right panels show the local concentration in the volume and a slice.
Video and data from
Animation: Ca2+ transient alternans in a model cell with realistic structure.
Only a portion of the cell is shown for clarity. Left panels show the intracellular (upper) and sarcoplasmic
reticulum (lower) whole-cell average concentrations; right panels show the local concentration in the volume and a slice.
Video and data from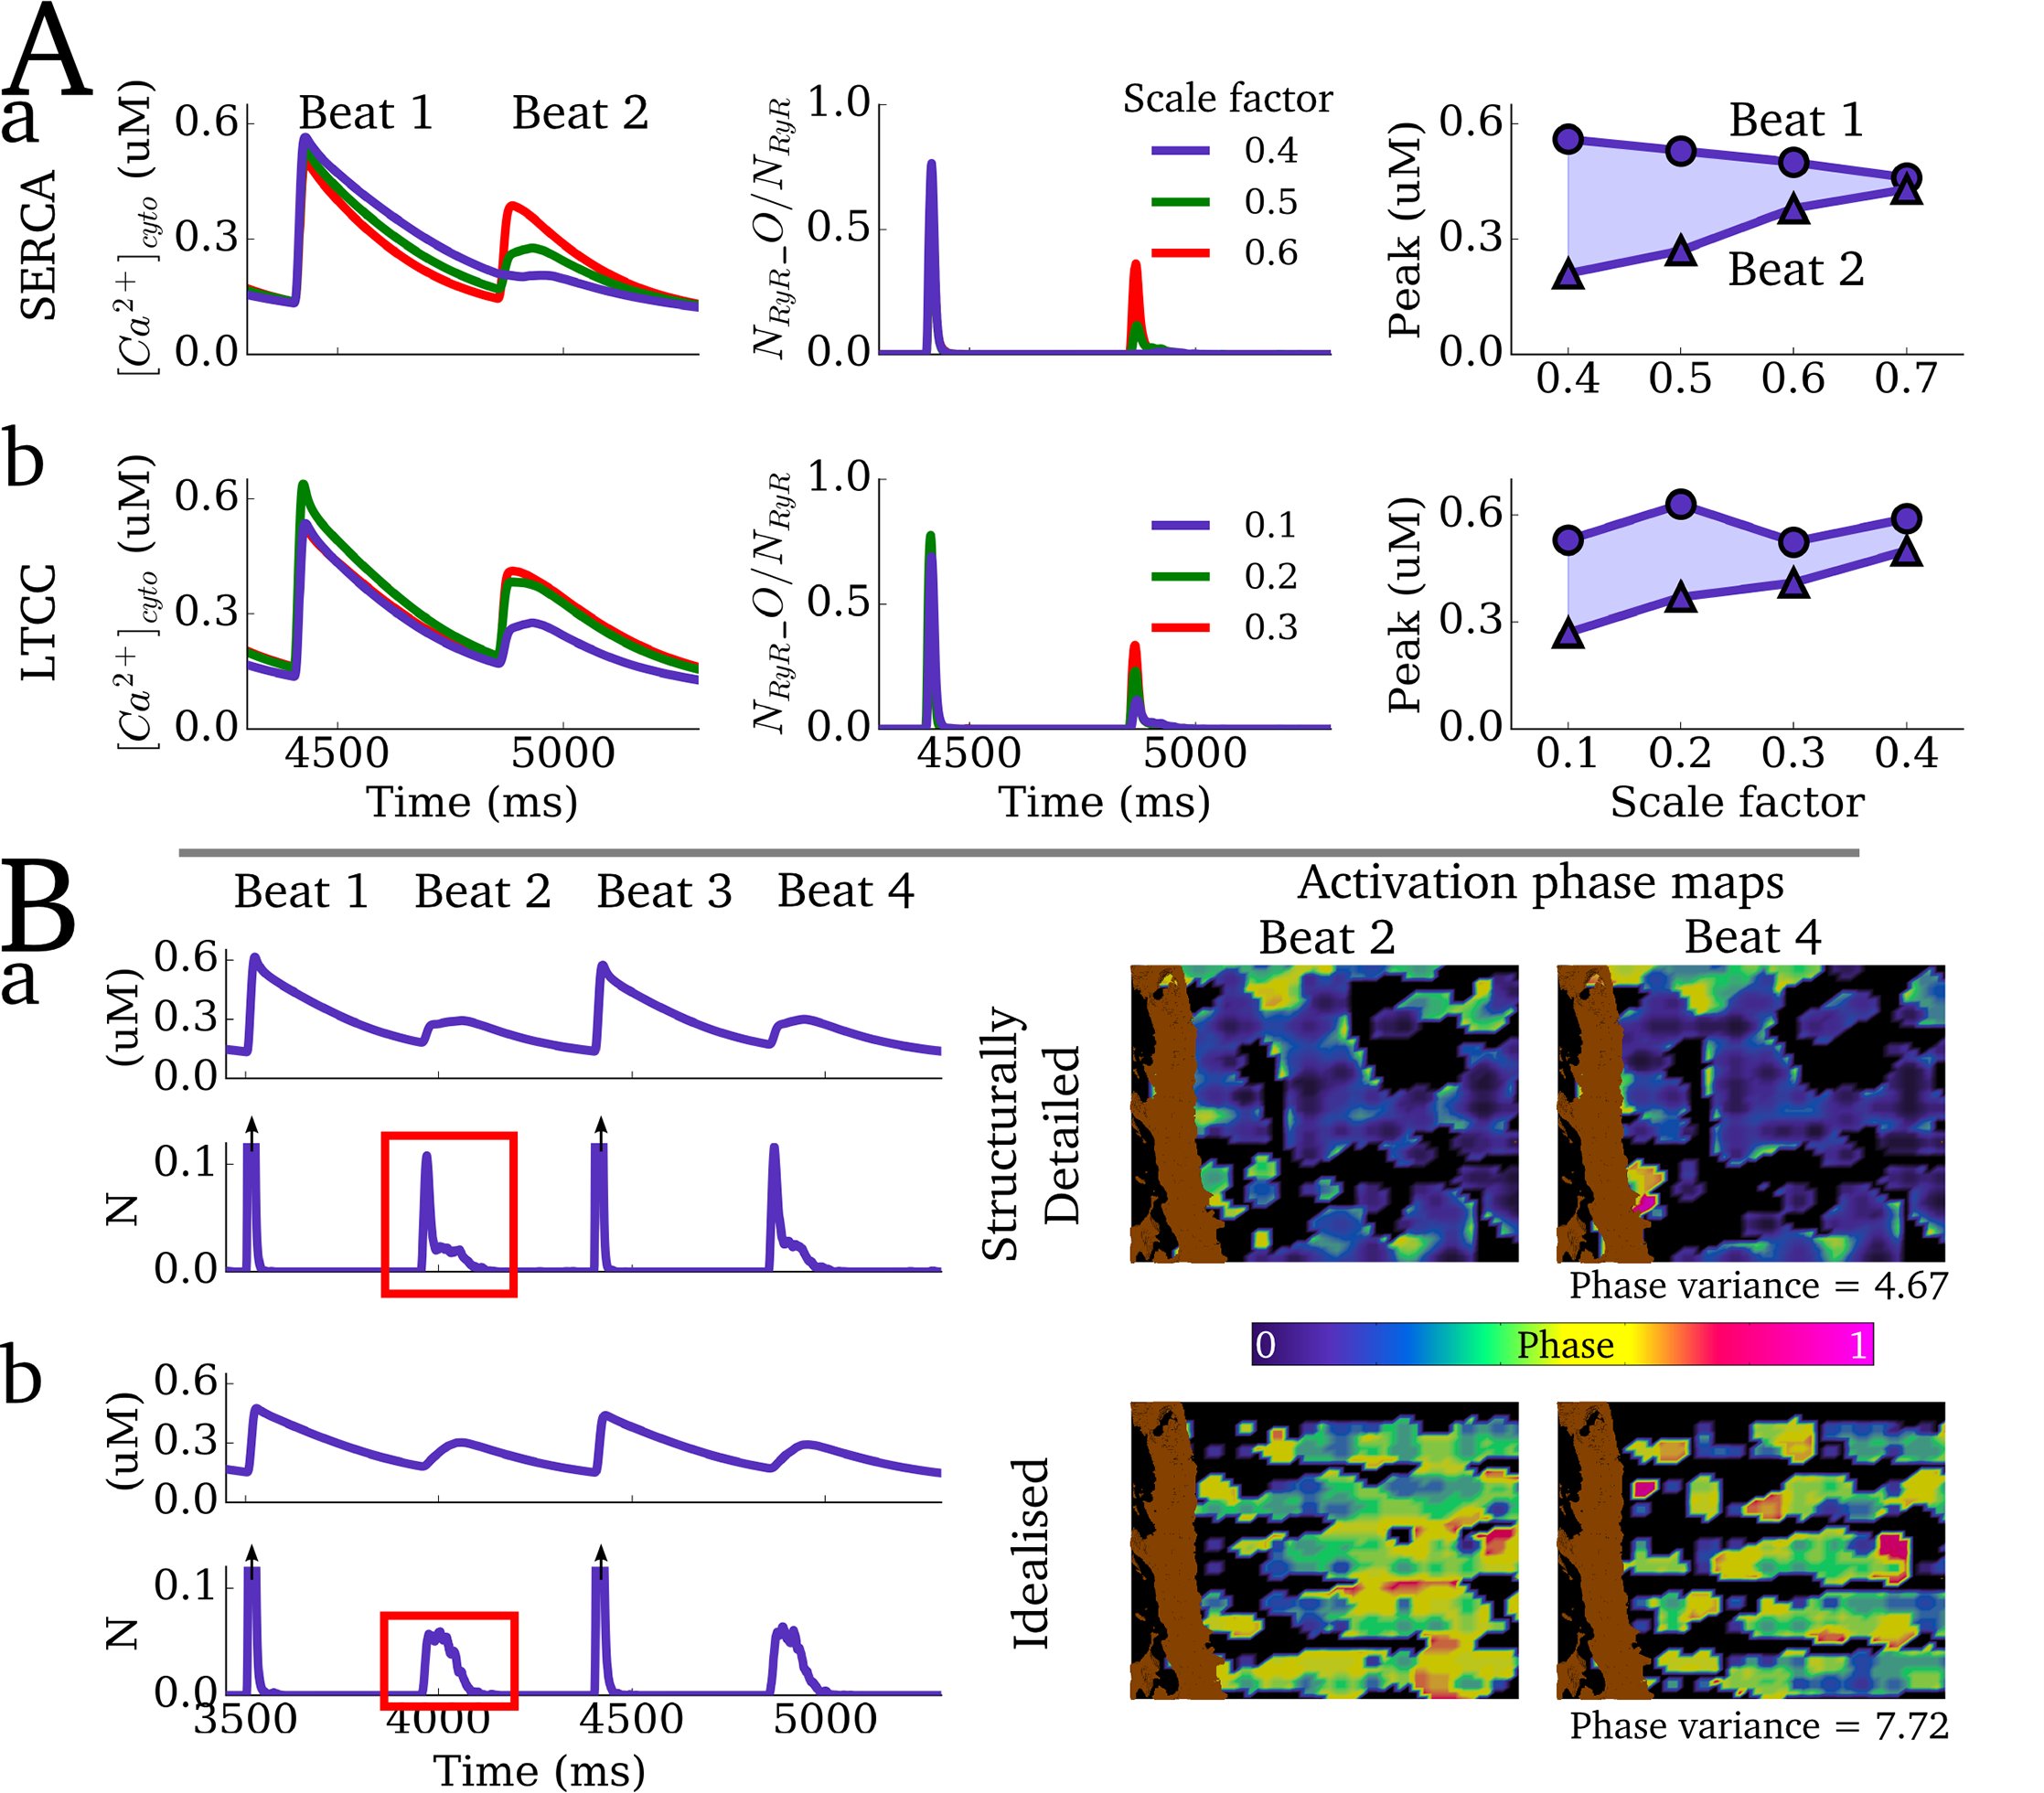 Figure: Alternan dynamics in the cell models. Upper panels show the magnitude of Ca2+ transient
alternans under different conditions. Lower panels show a comparison between realistic and idealised structure
models, highlighting the differences in phase maps on successive low-amplitude beats between the two cases.
Image and data from
Figure: Alternan dynamics in the cell models. Upper panels show the magnitude of Ca2+ transient
alternans under different conditions. Lower panels show a comparison between realistic and idealised structure
models, highlighting the differences in phase maps on successive low-amplitude beats between the two cases.
Image and data from Animation: Spontaneous Ca2+ wave in the structurally detailed cell model. Upper panel shows the
whole-cell Ca2+ concentration; middle panel shows the Ca2+ concentration in the volume
of the cell, with the colours scaled to the magnitude of the whole-cell average; lower panel shows the same but
with the colours scaled to visualise the local gradients.
Video and data from
Animation: Spontaneous Ca2+ wave in the structurally detailed cell model. Upper panel shows the
whole-cell Ca2+ concentration; middle panel shows the Ca2+ concentration in the volume
of the cell, with the colours scaled to the magnitude of the whole-cell average; lower panel shows the same but
with the colours scaled to visualise the local gradients.
Video and data from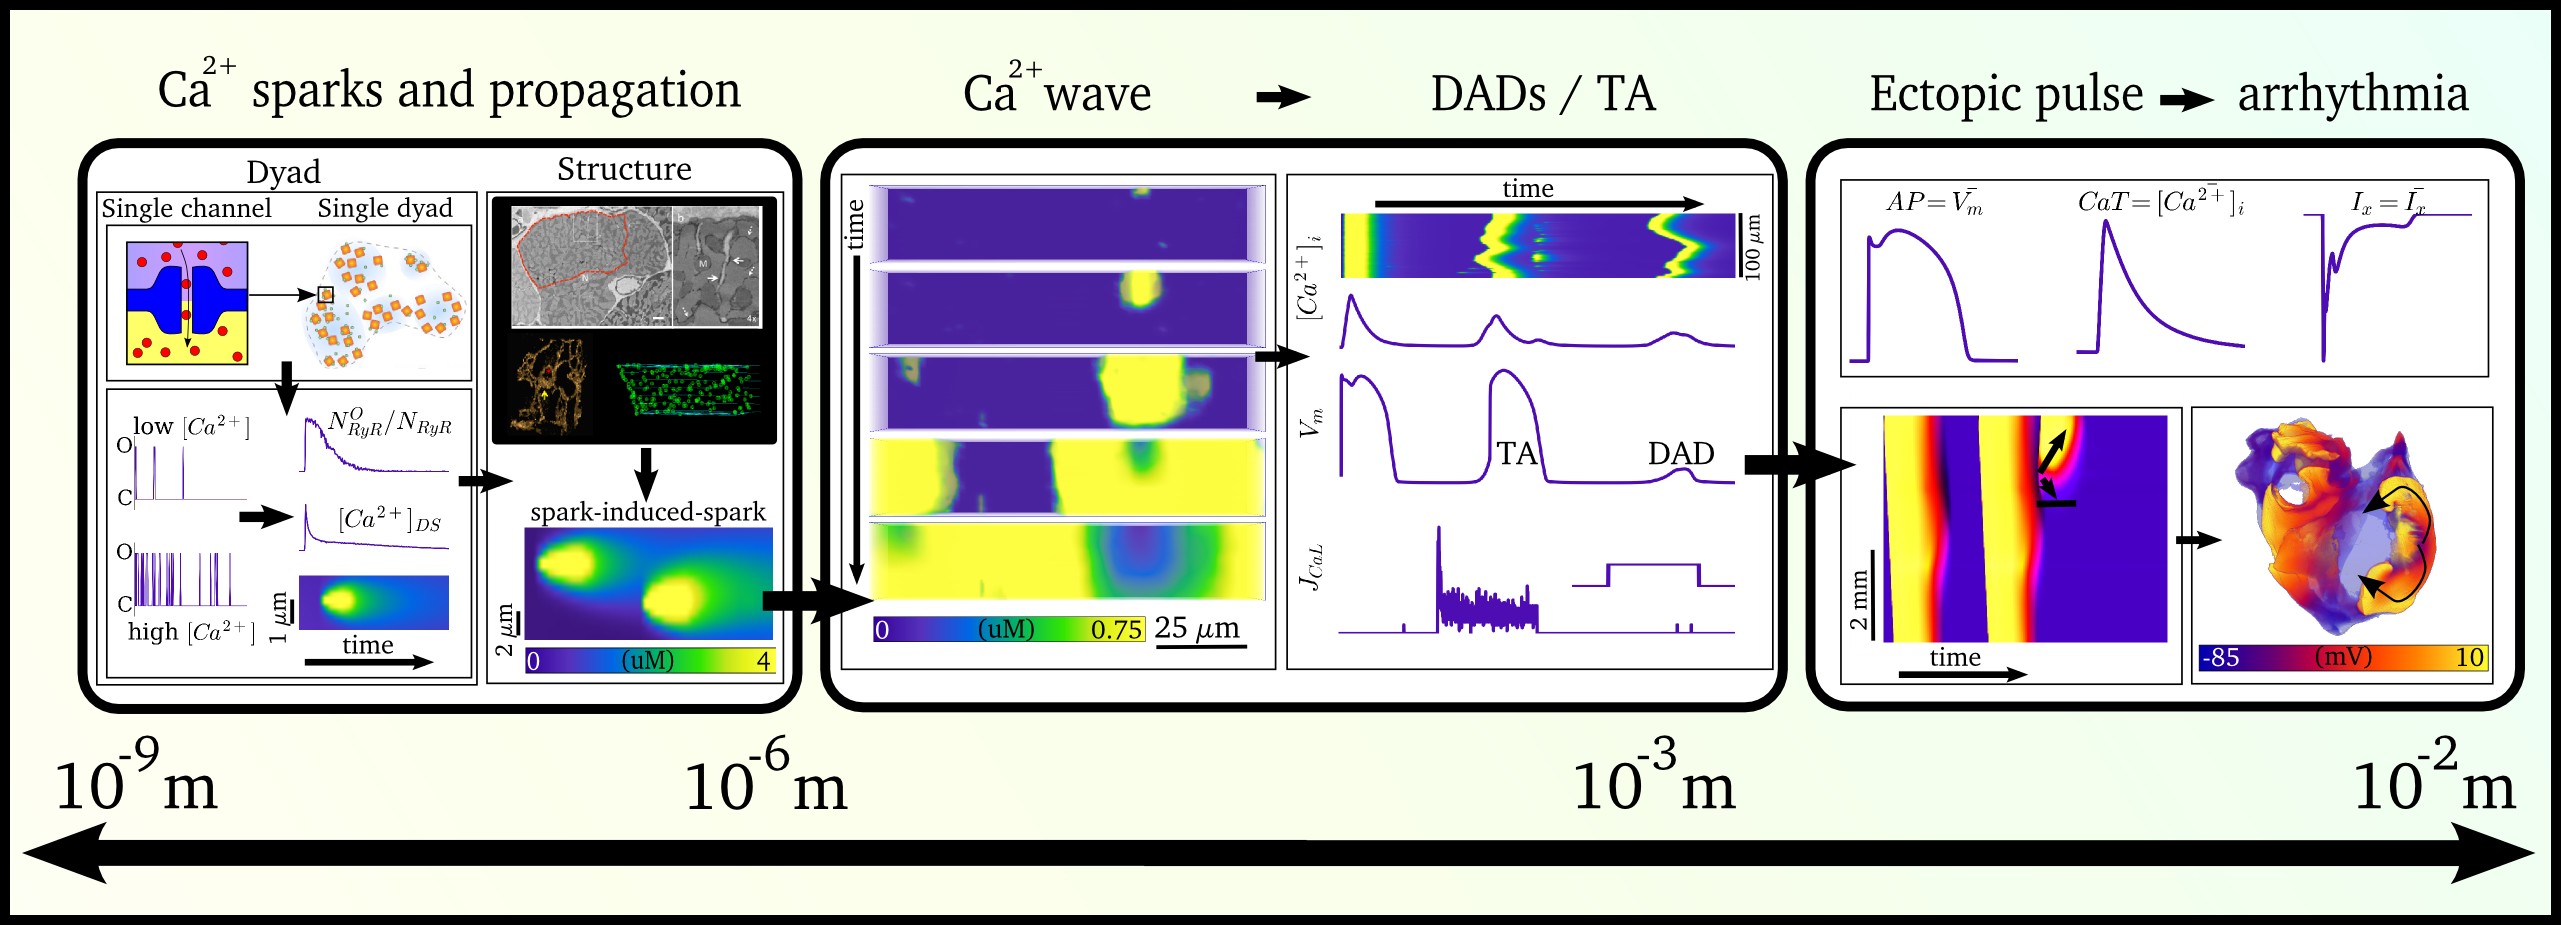 Illustration of the scales involved in the different phenomena for which spontaneous Ca2+ release
can manifest as arrhythmia. Left panel illustrates the local behaviour at the single-channel level and
cell-structure which allows Ca2+ sparks to propagate; middle panel shows the cellular behaviour
leading to spontaneous Action Potentials (“TA”); right panel shows the interaction of spontaneous focal
excitation and tissue properties which can give rise to re-entry. The length-scales are illustrated, from
the nanometre (billionth of a metre; 10-9) to the centimetre (10-2).
Illustration of the scales involved in the different phenomena for which spontaneous Ca2+ release
can manifest as arrhythmia. Left panel illustrates the local behaviour at the single-channel level and
cell-structure which allows Ca2+ sparks to propagate; middle panel shows the cellular behaviour
leading to spontaneous Action Potentials (“TA”); right panel shows the interaction of spontaneous focal
excitation and tissue properties which can give rise to re-entry. The length-scales are illustrated, from
the nanometre (billionth of a metre; 10-9) to the centimetre (10-2).
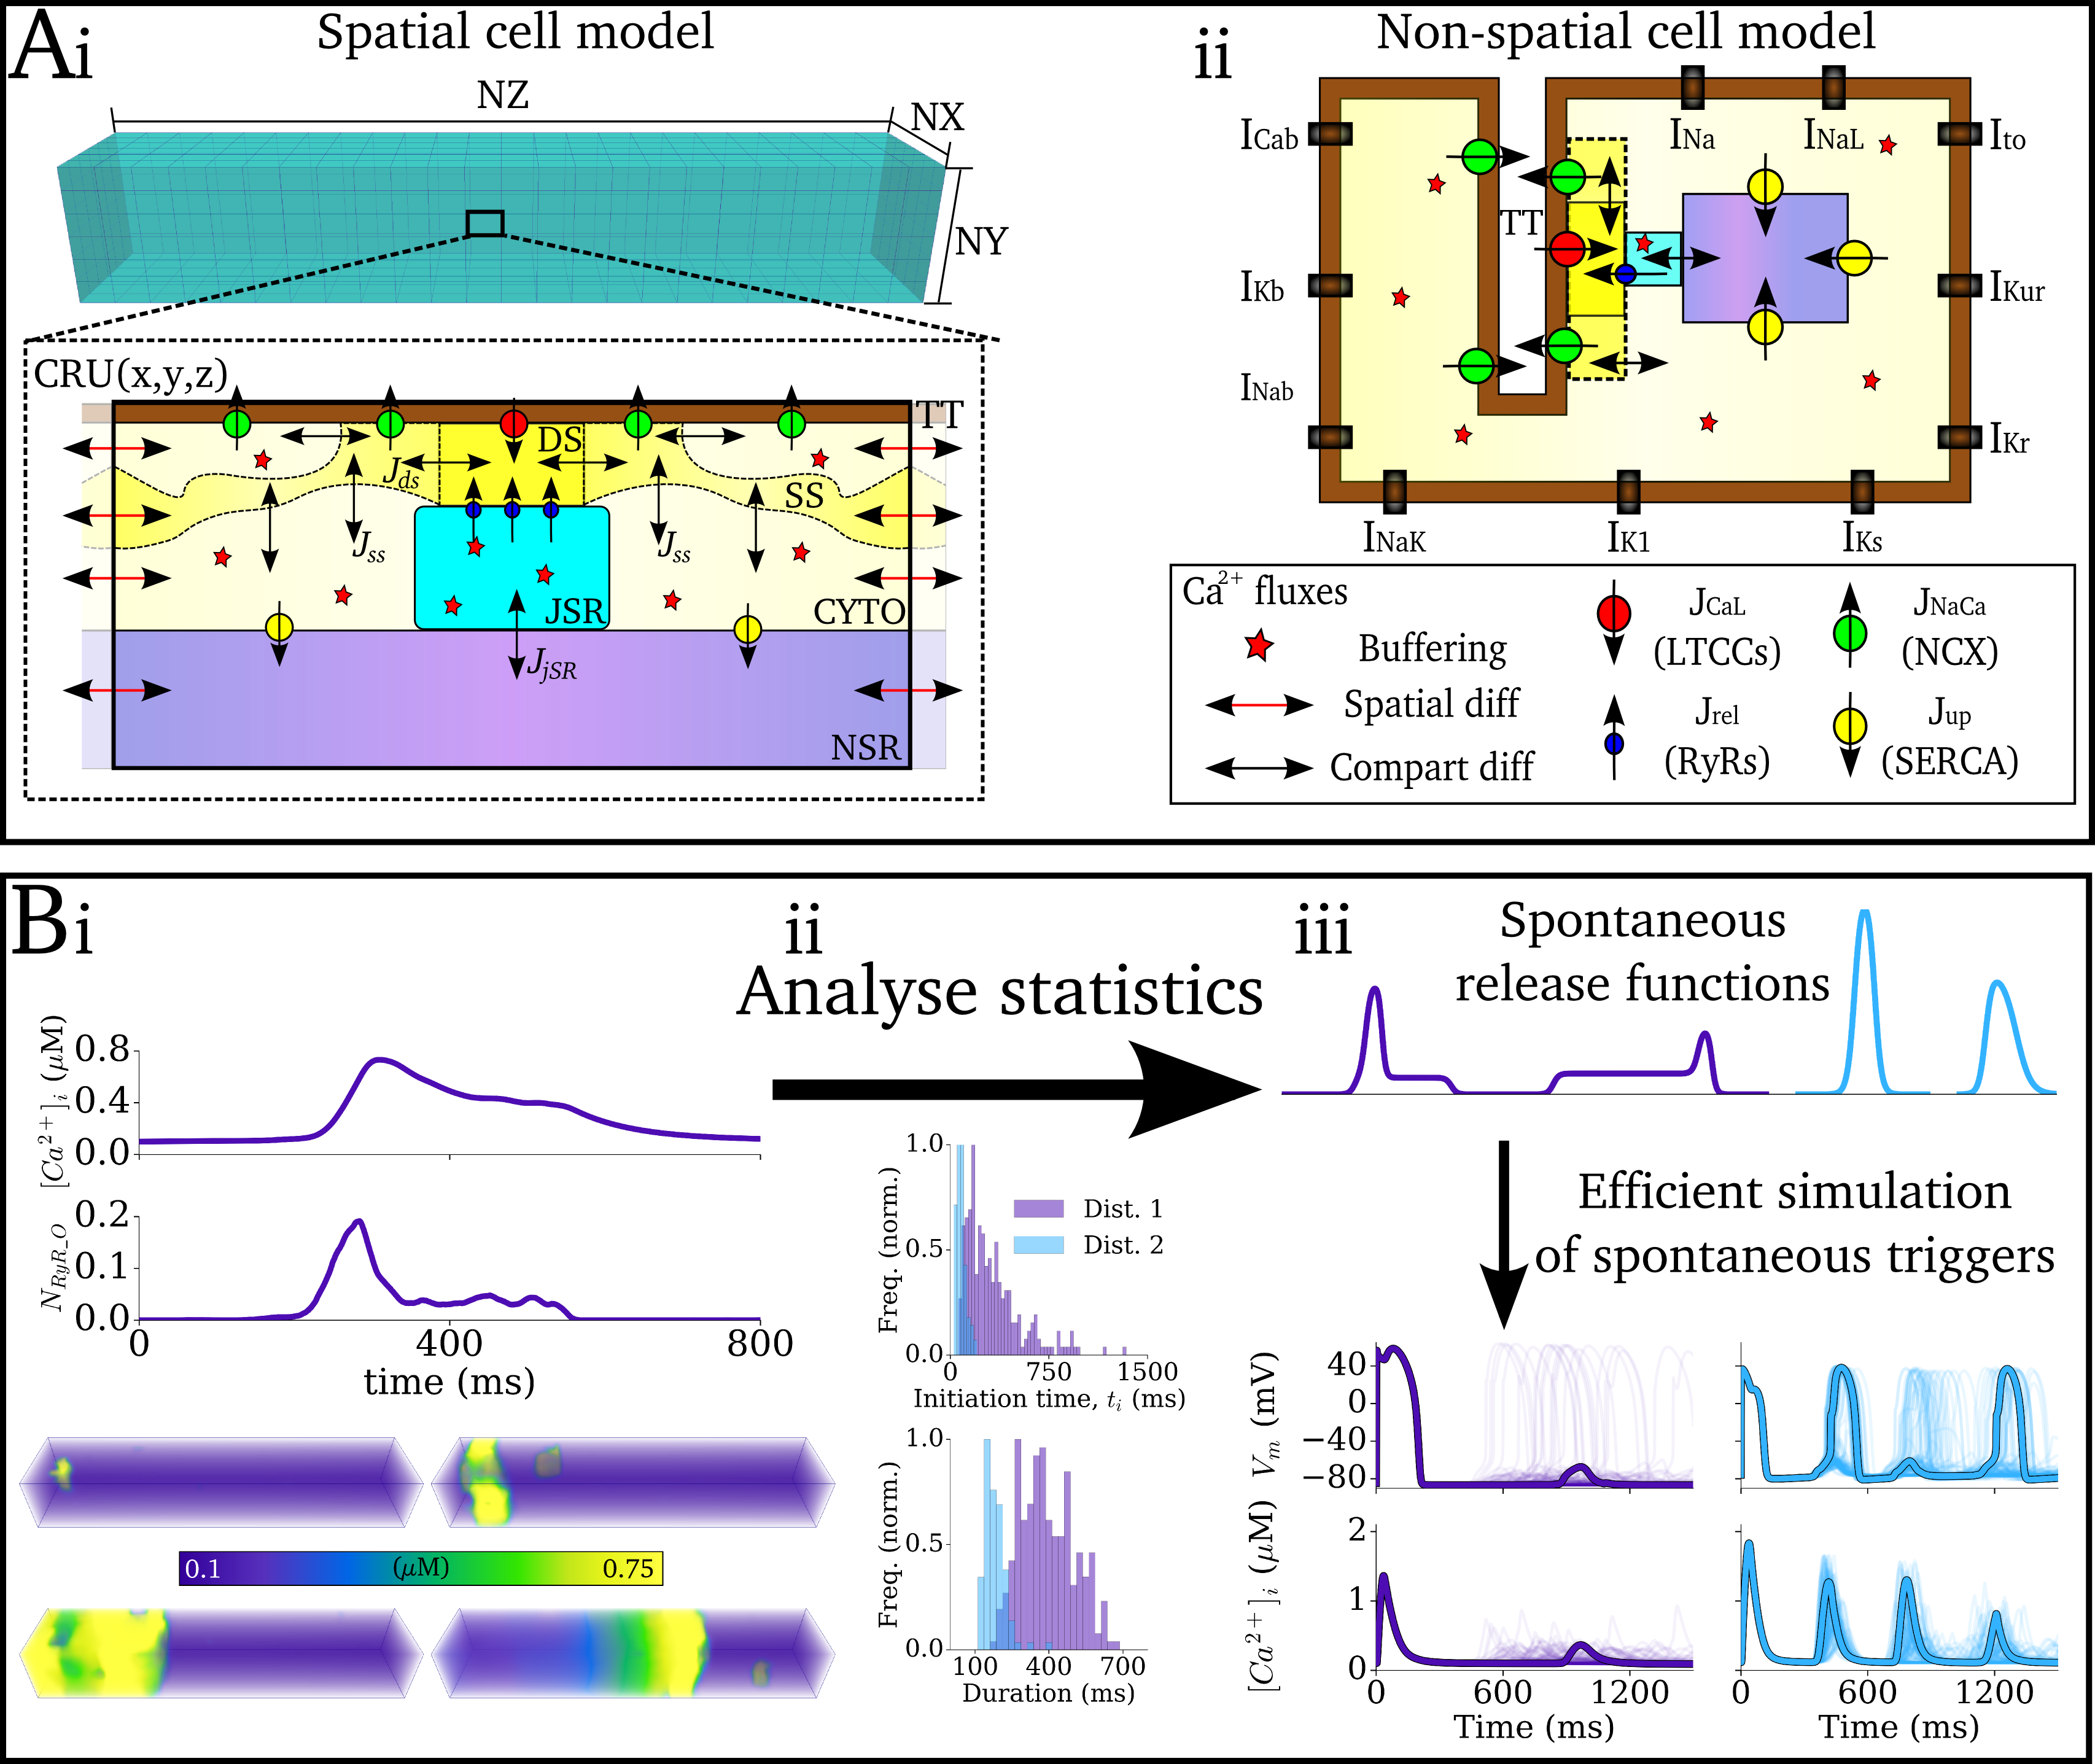 Illustration of the approaches to model spontaneous Ca2+ release in computationally efficient cell models.
Panel A shows the structure of detailed spatial cell model (left) and the point-source non-spatial cell model
(which considers the cell as a single volume). Panel B illustrates the use of analysing the statistics
of the spatial cell model to define waveform functions which can be implemented in the non-spatial cell model.
Illustration of the approaches to model spontaneous Ca2+ release in computationally efficient cell models.
Panel A shows the structure of detailed spatial cell model (left) and the point-source non-spatial cell model
(which considers the cell as a single volume). Panel B illustrates the use of analysing the statistics
of the spatial cell model to define waveform functions which can be implemented in the non-spatial cell model.
 Simulation of the emergence of focal excitation in tissue following spontaneous Ca2+ release in
individual cells. Both panels show an idealised 2D sheet of cardiac muscle; the left shows the Ca2+
concentrations in individual cells, and right the membrane potential. The noise in the left panel is the independently timed
spontaneous Ca2+ release, which coordinate through tissue coupling to lead to a focal excitation.
Video and data from
Simulation of the emergence of focal excitation in tissue following spontaneous Ca2+ release in
individual cells. Both panels show an idealised 2D sheet of cardiac muscle; the left shows the Ca2+
concentrations in individual cells, and right the membrane potential. The noise in the left panel is the independently timed
spontaneous Ca2+ release, which coordinate through tissue coupling to lead to a focal excitation.
Video and data from 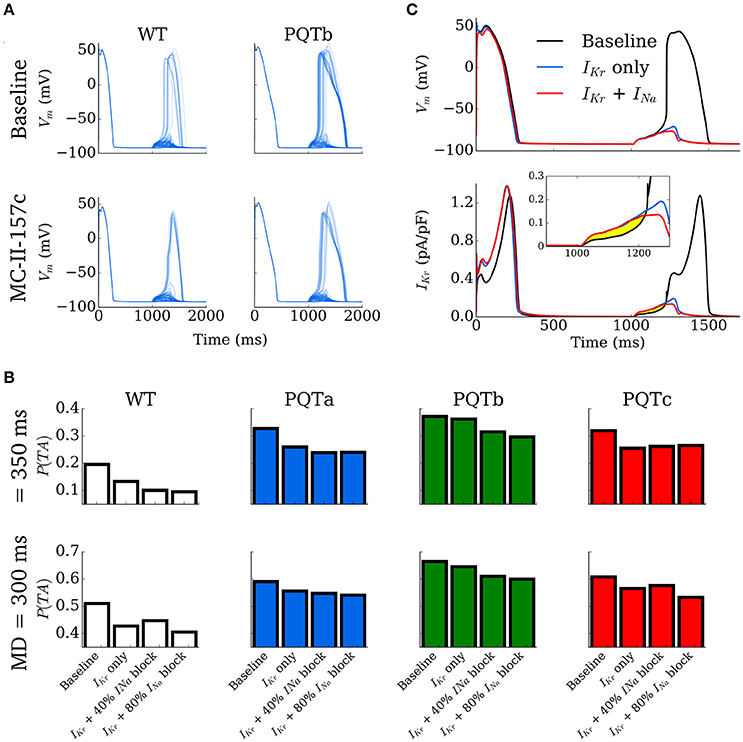 Figure: Cellular behaviour in control and long-QT conditions, with and without the application of a
pharmacological agent (“MC-II-157c”). Shown is the probability of a spontaneous Ca2+ release resulting
in a full triggered Action Potential, and the impact of the pharmacological agent.
Image and data from
Figure: Cellular behaviour in control and long-QT conditions, with and without the application of a
pharmacological agent (“MC-II-157c”). Shown is the probability of a spontaneous Ca2+ release resulting
in a full triggered Action Potential, and the impact of the pharmacological agent.
Image and data from 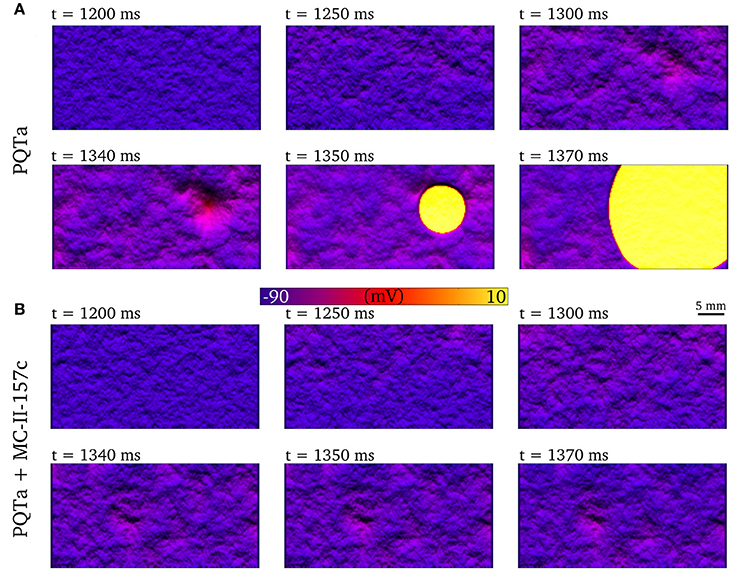 Figure: Emergence of a spontaneous focal excitation in the long QT syndrome condition, which is
inhibited by the application of the pharmacological agent.
Image and data from
Figure: Emergence of a spontaneous focal excitation in the long QT syndrome condition, which is
inhibited by the application of the pharmacological agent.
Image and data from  Animation: Re-entry followed by focal excitation in a 3D model of the human atria. Left panel shows the voltage, middle
the intracellular Ca2+ and right the sarcoplasmic reticulum Ca2+ concentration. A few cycles of re-entry
are shown, before the behaviour self-terminates; this is followed by multiple focal excitations, which are caused by the
high sarcoplasmic reticulum Ca2+ load induced by the rapid re-entrant excitation.
Video and data from
Animation: Re-entry followed by focal excitation in a 3D model of the human atria. Left panel shows the voltage, middle
the intracellular Ca2+ and right the sarcoplasmic reticulum Ca2+ concentration. A few cycles of re-entry
are shown, before the behaviour self-terminates; this is followed by multiple focal excitations, which are caused by the
high sarcoplasmic reticulum Ca2+ load induced by the rapid re-entrant excitation.
Video and data from 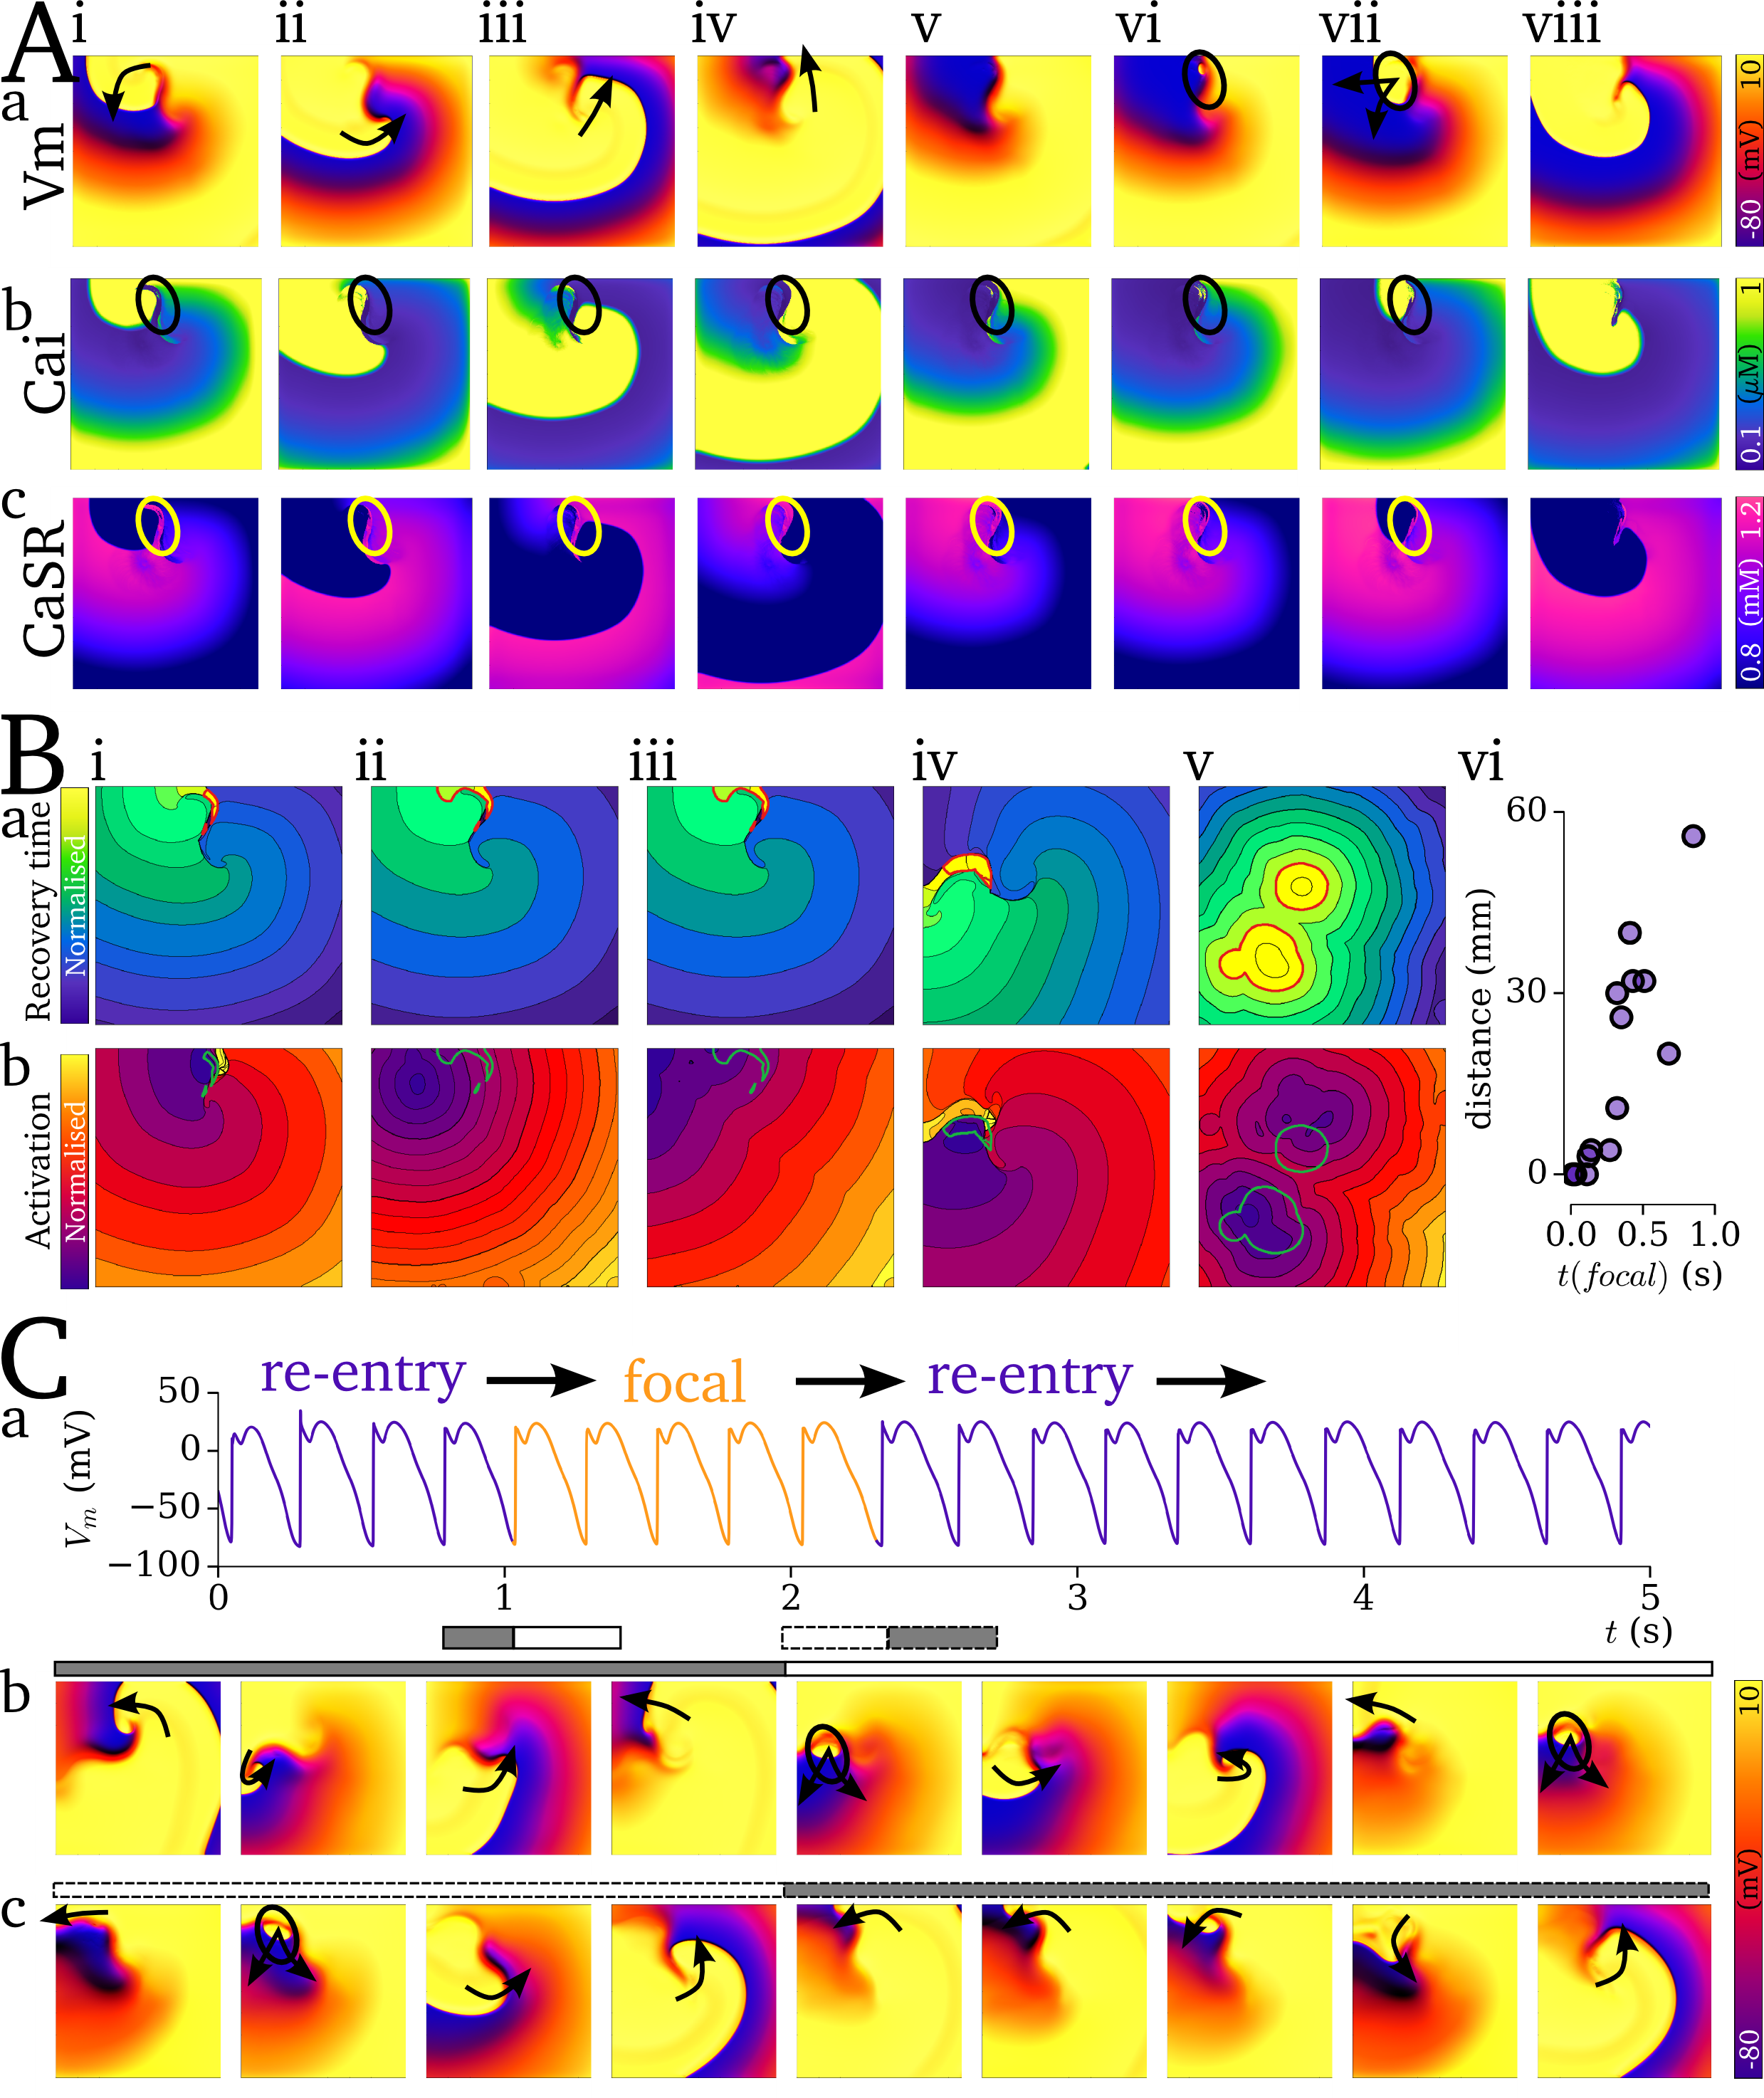 Figure: Co-localisation of re-entry and focal excitation. The top panels show the evolution of voltage and Ca2+
during the final re-entrant excitation and the first focal. Middle panel shows how these are localised dependant on the timing
of the focal excitation. Bottom panel shows a simulation which involved mechanism switching between re-entrant and focal excitation.
Image and data from
Figure: Co-localisation of re-entry and focal excitation. The top panels show the evolution of voltage and Ca2+
during the final re-entrant excitation and the first focal. Middle panel shows how these are localised dependant on the timing
of the focal excitation. Bottom panel shows a simulation which involved mechanism switching between re-entrant and focal excitation.
Image and data from 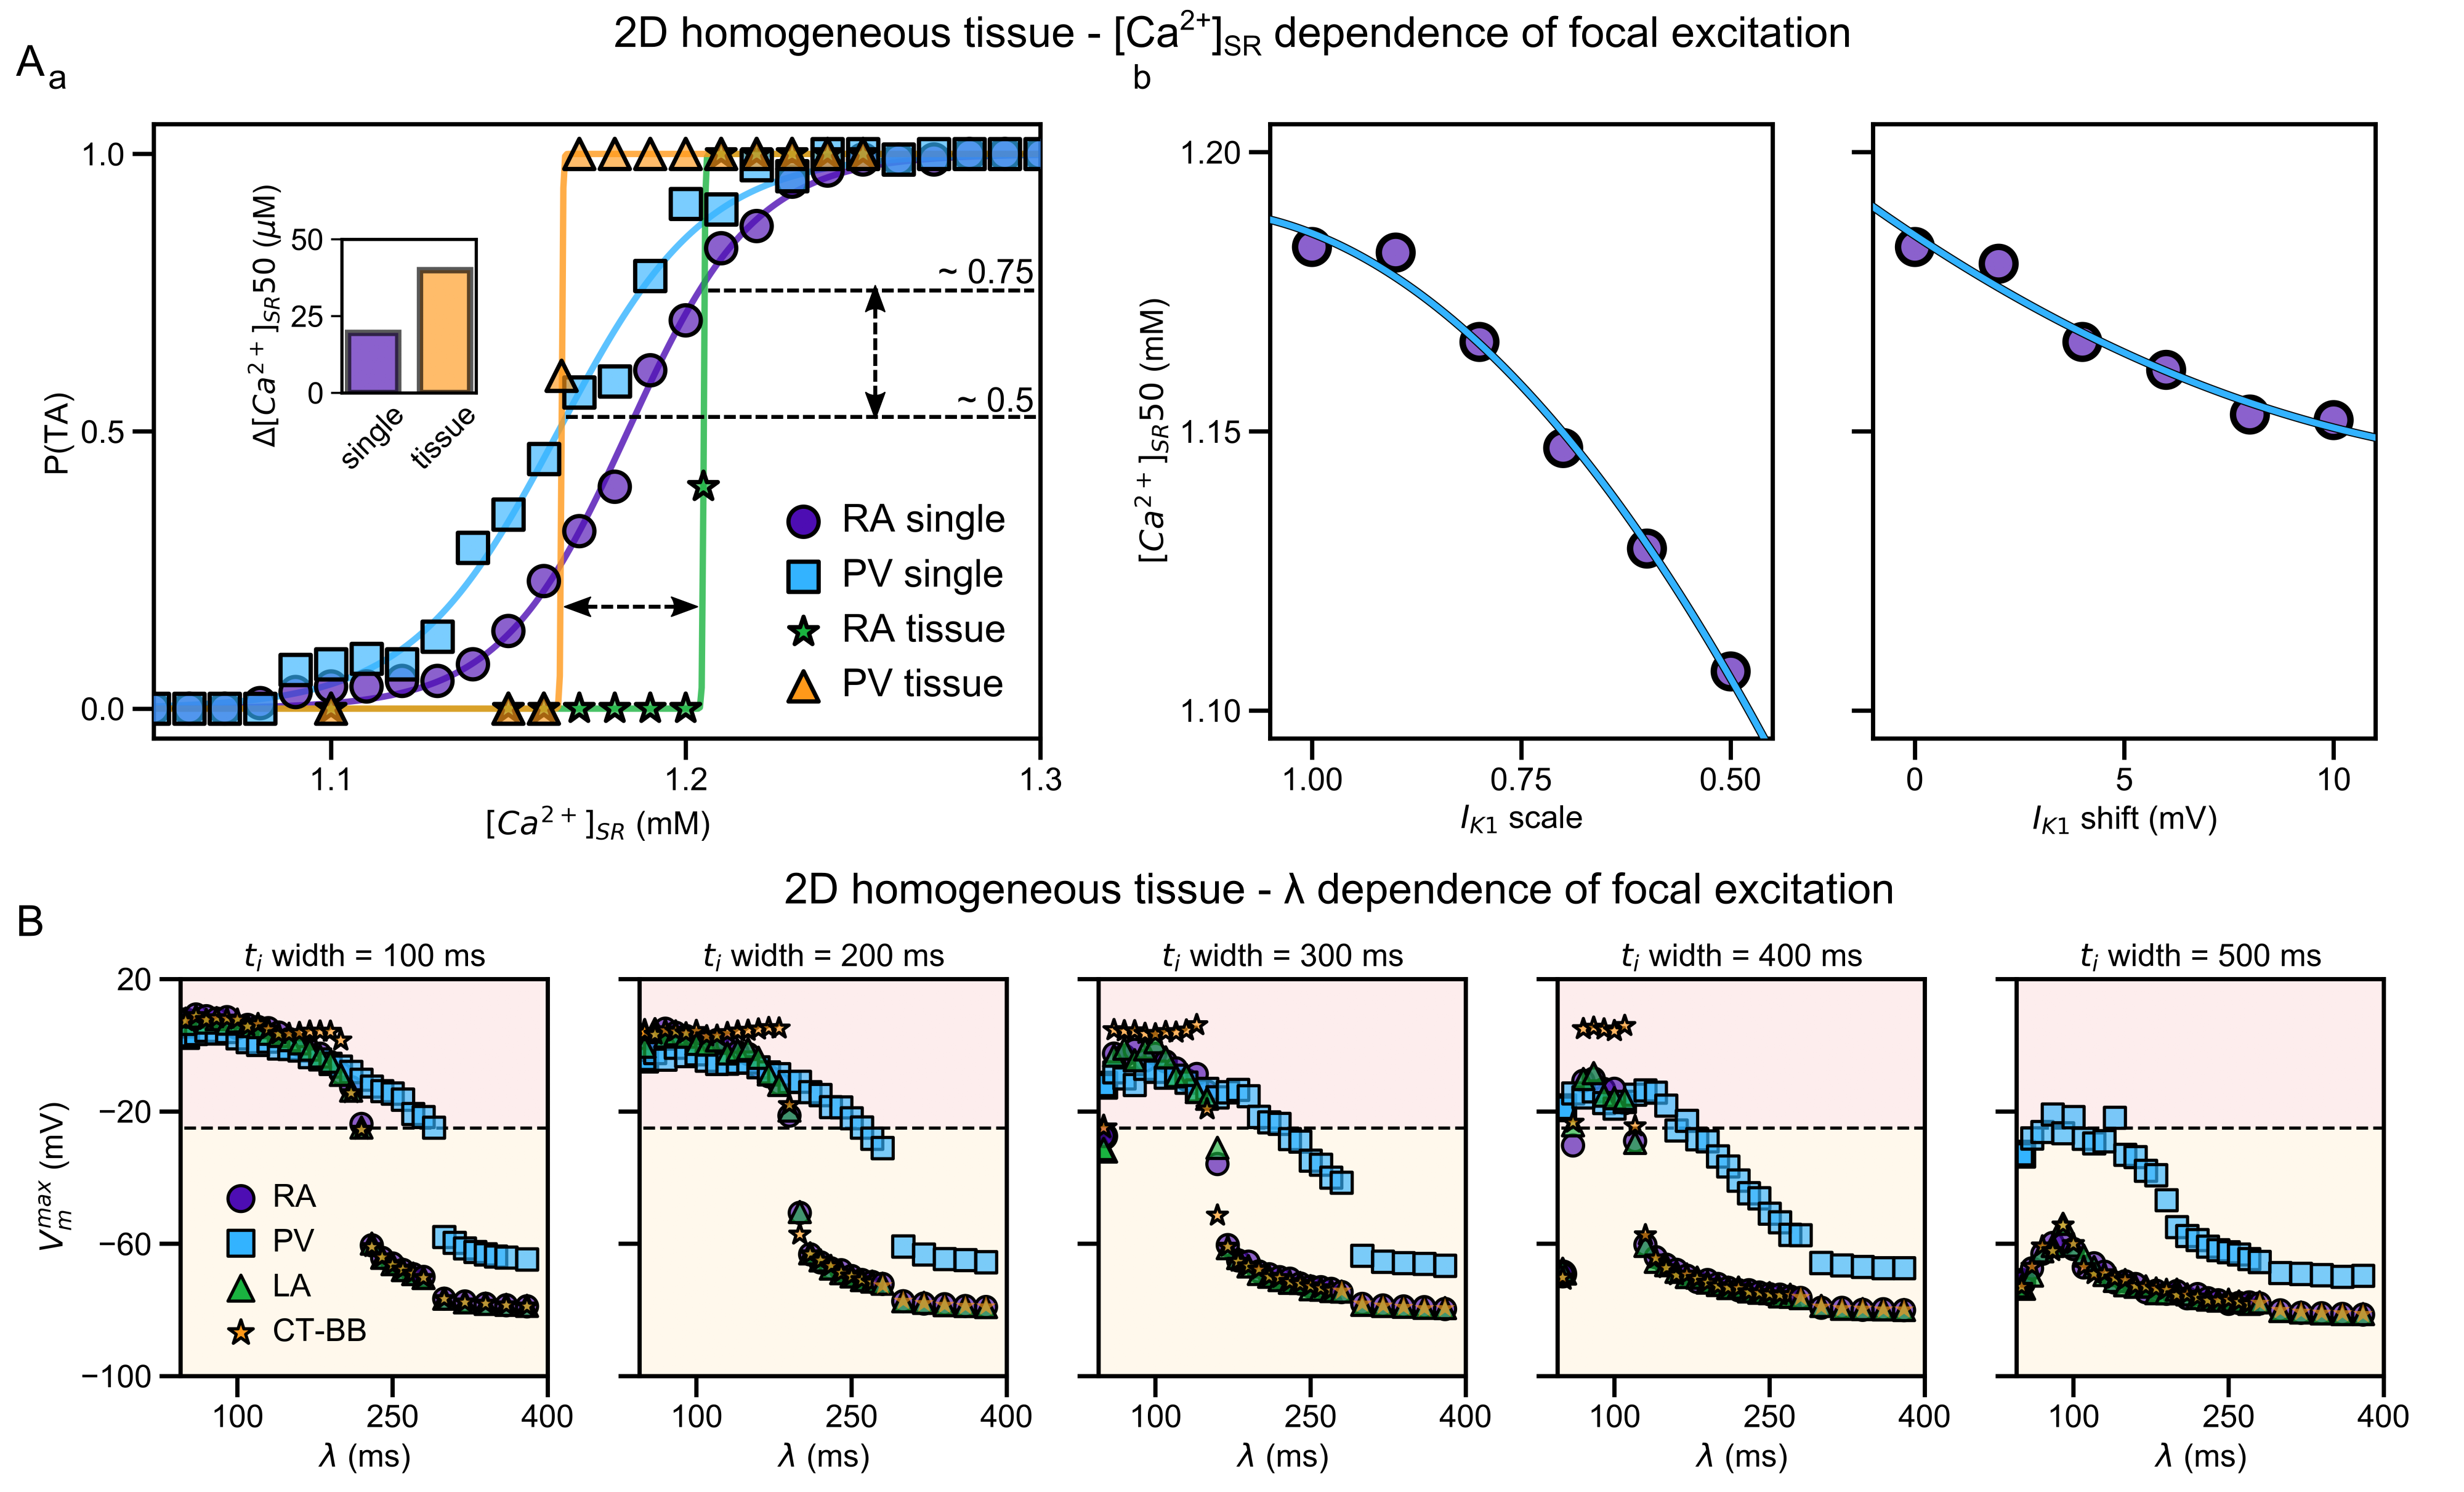 Illustration of the higher susceptibility of the pulmonary vein (PV) region to abnormal spontaneous excitation.
From
Illustration of the higher susceptibility of the pulmonary vein (PV) region to abnormal spontaneous excitation.
From  Animation: Spontaneous initation of re-entrant-like activity originating at the border of a fibrosis and non-fibrosis region.
From:
Animation: Spontaneous initation of re-entrant-like activity originating at the border of a fibrosis and non-fibrosis region.
From: